Navigation

    Logo
    • Register
    • Login
    • Search
    • Recent
    • Tags
    • Unread
    • Categories
    • Unreplied
    • Popular
    • GitHub
    • Docu
    • Hilfe
    1. Home
    2. Deutsch
    3. ioBroker Allgemein
    4. Grafana wird nicht in VIS und Jarvis angezeigt

    NEWS

    • Neues Video über Aliase, virtuelle Geräte und Kategorien

    • Wir empfehlen: Node.js 22.x

    • Neuer Blog: Fotos und Eindrücke aus Solingen

    Grafana wird nicht in VIS und Jarvis angezeigt

    This topic has been deleted. Only users with topic management privileges can see it.
    • SKB
      SKB Developer Most Active @JayR last edited by

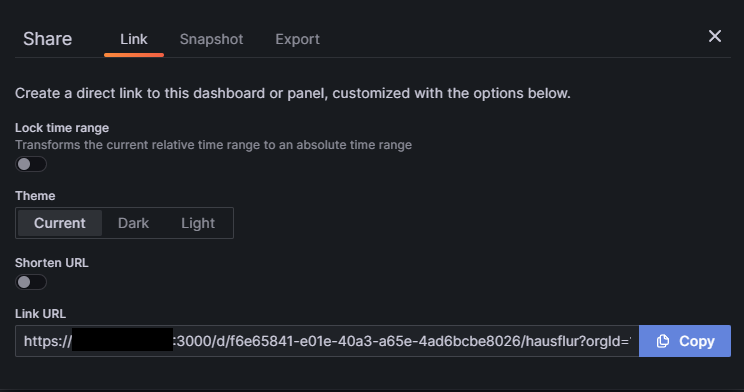
      @jayr Falls das Problem immer noch besteht, achte einmal drauf, das die Schalter für "shorten URL" und "Lock time range" nicht aktiv sind.

      1 Reply Last reply Reply Quote 0
      • F
        Flo 0 last edited by Flo 0

        Hatte das gleiche Problem. Stelle grafana auf https um. Danach sollte es gehen.

        H 1 Reply Last reply Reply Quote 0
        • H
          Hans_M @Flo 0 last edited by

          @flo-0 hallo, habe auch das Problem, dass bei Fernzugriff über die Cloud, die Grafana Charts nicht angezeigt werden.
          Wie stellt man Grafana auf https um?

          SKB 1 Reply Last reply Reply Quote 0
          • SKB
            SKB Developer Most Active @Hans_M last edited by

            @hans_m https://community.grafana.com/t/grafana-https-configuration/524

            1 Reply Last reply Reply Quote 0
            • S
              smarthome2020 last edited by smarthome2020

              Hi,
              ich probiere seit Stunden herum. Leider bekomme ich es nicht hin, dass mir die Charts von Grafana bei Jarvis angezeigt werden.

              Bin nach folgender Anleitung vorgegangen, um Grafana auf https umzustellen.

              Nun kann ich Grafana nur noch per https://ip:3000 aufrufen.
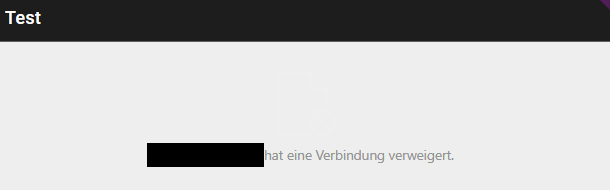
              Es kommt aber folgender Eintrag im Browser:
              BSP.png

              Lief da was falsch? Wenn ich nun versuche, ein iFrame-Widget anzulegen, dann beziehe ich die URL aus Grafana über den Share-Button (Lock time range --> aus; Shorten URL --> aus) und importiere die URL dann in das Widget.

              Ergebnis bei Jarvis ist dann:
              tet.png

              S 1 Reply Last reply Reply Quote 0
              • S
                smarthome2020 @smarthome2020 last edited by

                @smarthome2020
                Ich antworte mir mal selber:

                Mittlerweile komme ich etwas weiter. Habe in der grafana.ini "allow_embedding = yes" eingestellt. Allerdings kann ich unter Verwendung folgenden Links: tet.png

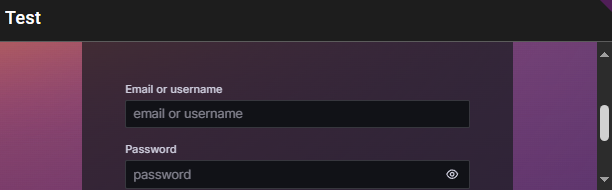
                immer noch nicht im iFrame-Widget die Grafana-Temperaturkurve sehen.
                Es kommt dann ein "Login-Fenster":
                BSP.png

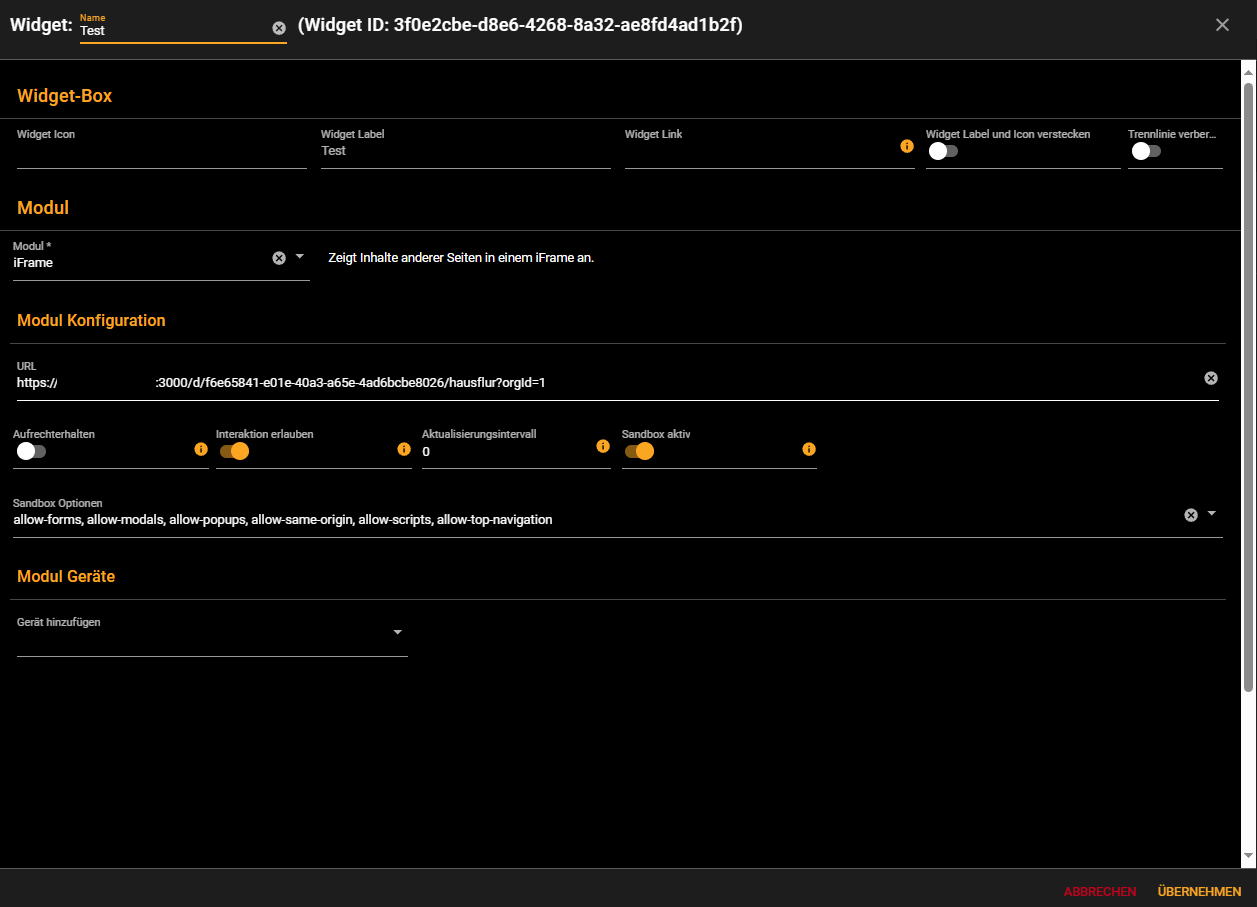
                Widget sieht wie folgt aus:
                vorÄnderung.png

                Hat jemand eine Idee, was noch falsch sein könnte? @MCU vllt?

                J 1 Reply Last reply Reply Quote 0
                • J
                  Jaksa @smarthome2020 last edited by

                  @smarthome2020

                  Hast du den Anonymen Zugriff in der ini auch aktiviert?

                  Siehe hier:

                  https://forum.iobroker.net/topic/65371/grafana-ini-ändern/12

                  Danach Grafana am besten einmal neu starten.

                  S 1 Reply Last reply Reply Quote 0
                  • S
                    smarthome2020 @Jaksa last edited by smarthome2020

                    @jaksa
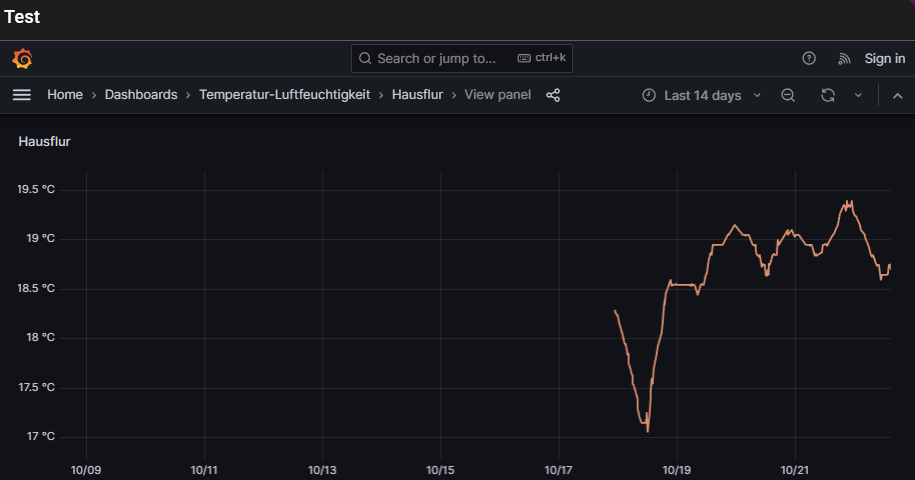
                    Super, nun sieht es schon besser aus, danke dir.

                    Kann man sich die Darstellung auch ohne den Rest der "Seite" anzeigen lassen? Will nur die Grafik bei Jarvis einbinden ohne die Einstellungsmöglichkeiten von Grafana mit dabei zu haben (sprich: nur die Kurvenansicht).

                    So sieht es aktuell aus:
                    BSP.png

                    J 1 Reply Last reply Reply Quote 0
                    • J
                      Jaksa @smarthome2020 last edited by

                      @smarthome2020

                      Einfach ein "&kiosk=1" an die URL hinten anhängen.

                      S 1 Reply Last reply Reply Quote 0
                      • S
                        smarthome2020 @Jaksa last edited by

                        @jaksa sagte in Grafana wird nicht in VIS und Jarvis angezeigt:

                        &kiosk=1

                        Tut mir leid, davon hatte ich sogar gelesen, nur den Kontext nicht mit aufgenommen. Danke für deine Hilfe 🙂 Schönen Sonntag noch

                        1 Reply Last reply Reply Quote 0
                        • First post
                          Last post

                        Support us

                        ioBroker
                        Community Adapters
                        Donate
                        FAQ Cloud / IOT
                        HowTo: Node.js-Update
                        HowTo: Backup/Restore
                        Downloads
                        BLOG

                        868
                        Online

                        32.0k
                        Users

                        80.5k
                        Topics

                        1.3m
                        Posts

                        6
                        13
                        1497
                        Loading More Posts
                        • Oldest to Newest
                        • Newest to Oldest
                        • Most Votes
                        Reply
                        • Reply as topic
                        Log in to reply
                        Community
                        Impressum | Datenschutz-Bestimmungen | Nutzungsbedingungen
                        The ioBroker Community 2014-2023
                        logo