Navigation

    Logo
    • Register
    • Login
    • Search
    • Recent
    • Tags
    • Unread
    • Categories
    • Unreplied
    • Popular
    • GitHub
    • Docu
    • Hilfe
    1. Home
    2. Deutsch
    3. Off Topic
    4. Grafana
    5. Gelöst: Grafana Zusammenfassung einzelner Werte zu Tageswert

    NEWS

    • ioBroker@Smart Living Forum Solingen, 14.06. - Agenda added

    • ioBroker goes Matter ... Matter Adapter in Stable

    • Monatsrückblick - April 2025

    Gelöst: Grafana Zusammenfassung einzelner Werte zu Tageswert

    This topic has been deleted. Only users with topic management privileges can see it.
    • M
      michihorn last edited by michihorn

      Hallo
      ich mache meine ersten Versuche mit Grafana, klappt ganz gut.
      Meine nächste Aufgabe soll sein, die Regenmengen die mir mein HM Wettersensor über rega liefert, täglich zu addieren und dann tageweise die Niederschlagsmengen in einer Bar Grafik darstellt. Wie geht das?
      Michael

      B 1 Reply Last reply Reply Quote 0
      • B
        bloop @michihorn last edited by

        @michihorn influxdb 1 oder 2?

        M 1 Reply Last reply Reply Quote 0
        • M
          michihorn @bloop last edited by

          @bloop influxdb 2

          Homoran 1 Reply Last reply Reply Quote 0
          • Homoran
            Homoran Global Moderator Administrators @michihorn last edited by

            @michihorn Bitte Threadtitel sinnvoll anpassen!

            1 Reply Last reply Reply Quote 0
            • B
              bloop last edited by

              @michihorn dann wirst du dich erst einmal etwas mit Flux auseinander setzen müssen.
              Lässt sich aber recht einfach über die Weboberfläche von Influx aufrufen. (:8086)
              Dort im Datenmonitor den gespeicherten Datensatz auswählen, konfigurieren und den im SkriptEditor angezeigten Code kopieren und in Grafana einfügen.
              Auf einen Tag gruppieren macht dir:

              aggregateWindow(every:1d, offset:-2h, fn:last, timesrc:“_start“)
              
              M 1 Reply Last reply Reply Quote 0
              • M
                michihorn @bloop last edited by michihorn

                @bloop sagte in Grafana:

                aggregateWindow(every:1d, offset:-2h, fn:last, timesrc:“_start“)

                Wo genau im Script lege ich Deinen Tag ab?
                So sieht mein Script im influx aus

                Ich bekomme auf dem Vorschauscreen den Hinweis:

                from(bucket: "iobroker")
                  |> range(start: v.timeRangeStart, stop: v.timeRangeStop)
                  |> filter(fn: (r) => r["_measurement"] == "hm-rega.0.43357")
                  |> filter(fn: (r) => r["_field"] == "value")
                  |> aggregateWindow(every:1d, offset:-2h, fn:last, timesrc:“_start“)
                

                Bar charts requires a string or time field
                bild2.png

                B 1 Reply Last reply Reply Quote 0
                • B
                  bloop @michihorn last edited by

                  @michihorn

                  import "timezone"
                  option location = timezone.location(name: "Europe/Berlin")
                  
                  from(bucket: "iobroker")
                   |> range(start: v.timeRangeStart, stop: v.timeRangeStop)
                   |> filter(fn: (r) => r["_measurement"] == "hm-rega.0.1603")
                   |> filter(fn: (r) => r["_field"] == "value")
                   |> aggregateWindow(every: 1d, offset:-3d1s, fn: last, createEmpty: false)
                   |> yield(name: "mean")
                  

                  dee9f8d8-06ce-4ddb-aa84-1902f8298019-image.png

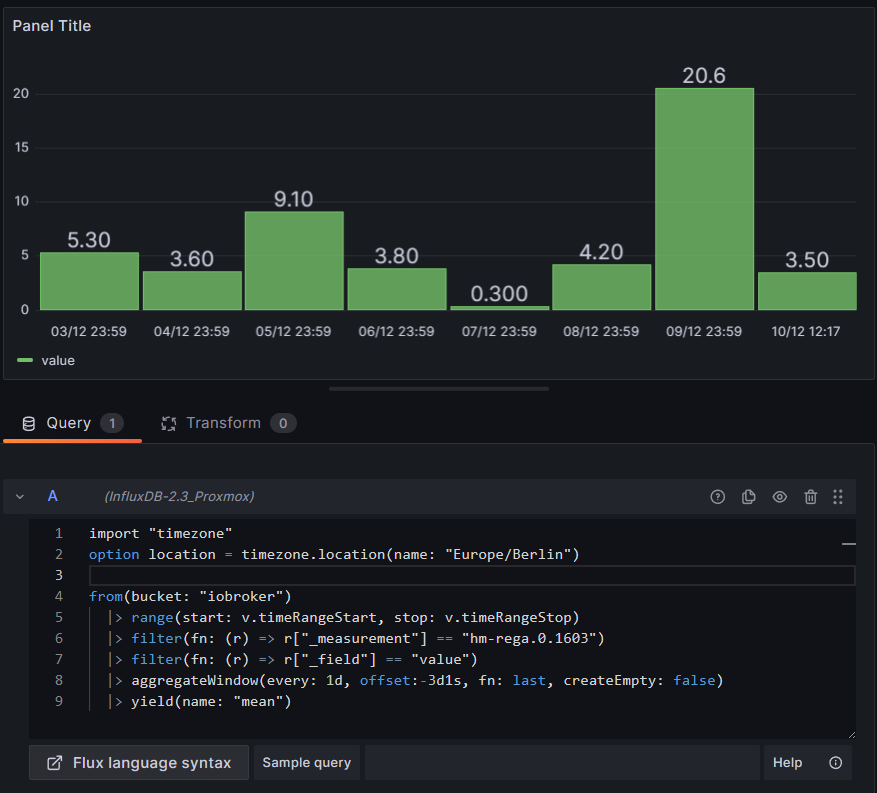
                  Wie geschrieben, am besten den Code in Influx for konfigurieren und dann copy/paste nach Grafana.

                  Ebenfalls zu empfehlen:
                  https://university.influxdata.com/

                  M 1 Reply Last reply Reply Quote 1
                  • M
                    michihorn @bloop last edited by

                    @bloop sagte in Grafana:

                    import "timezone" option location = timezone.location(name: "Europe/Berlin")

                    Könntest Du mir noch sagen wie du die Zeit- Achse im Deutschen Format hinbekommen hast?
                    Bei mir ist der Monat noch zuerst geführt

                    B Homoran 2 Replies Last reply Reply Quote 0
                    • B
                      bloop @michihorn last edited by

                      @michihorn ufff das ist schon einige Zeit her. Ich glaube das war in der Grafana config Datei zum einstellen.

                      1 Reply Last reply Reply Quote 0
                      • Marc Berg
                        Marc Berg Most Active last edited by

                        @michihorn sagte in Grafana:

                        Könntest Du mir noch sagen wie du die Zeit- Achse im Deutschen Format hinbekommen hast?
                        Bei mir ist der Monat noch zuerst geführt

                        da gibts einen eigenen Abschnitt in der grafana.ini

                        [date_formats]
                        # For information on what formatting patterns that are supported https://momentjs.com/docs/#/displaying/
                        
                        # Default system date format used in time range picker and other places where full time is displayed
                        full_date = DD.MM.YYYY HH:mm:ss
                        
                        # Used by graph and other places where we only show small intervals
                        interval_second = HH:mm:ss
                        interval_minute = HH:mm
                        interval_hour = DD.MM. HH:mm
                        interval_day = DD.MM.
                        interval_month = MM.YYYY
                        interval_year = YYYY
                        
                        
                        1 Reply Last reply Reply Quote 1
                        • Homoran
                          Homoran Global Moderator Administrators @michihorn last edited by

                          @michihorn

                          @homoran sagte in Grafana:

                          @michihorn Bitte Threadtitel sinnvoll anpassen!

                          1 Reply Last reply Reply Quote 0
                          • First post
                            Last post

                          Support us

                          ioBroker
                          Community Adapters
                          Donate

                          952
                          Online

                          31.7k
                          Users

                          79.7k
                          Topics

                          1.3m
                          Posts

                          4
                          11
                          828
                          Loading More Posts
                          • Oldest to Newest
                          • Newest to Oldest
                          • Most Votes
                          Reply
                          • Reply as topic
                          Log in to reply
                          Community
                          Impressum | Datenschutz-Bestimmungen | Nutzungsbedingungen
                          The ioBroker Community 2014-2023
                          logo