Navigation

    Logo
    • Register
    • Login
    • Search
    • Recent
    • Tags
    • Unread
    • Categories
    • Unreplied
    • Popular
    • GitHub
    • Docu
    • Hilfe
    1. Home
    2. Deutsch
    3. Off Topic
    4. Grafana
    5. Gelöst: Grafana Zusammenfassung einzelner Werte zu Tageswert

    NEWS

    • ioBroker@Smart Living Forum Solingen, 14.06. - Agenda added

    • ioBroker goes Matter ... Matter Adapter in Stable

    • Monatsrückblick - April 2025

    Gelöst: Grafana Zusammenfassung einzelner Werte zu Tageswert

    This topic has been deleted. Only users with topic management privileges can see it.
    • B
      bloop @michihorn last edited by

      @michihorn influxdb 1 oder 2?

      M 1 Reply Last reply Reply Quote 0
      • M
        michihorn @bloop last edited by

        @bloop influxdb 2

        Homoran 1 Reply Last reply Reply Quote 0
        • Homoran
          Homoran Global Moderator Administrators @michihorn last edited by

          @michihorn Bitte Threadtitel sinnvoll anpassen!

          1 Reply Last reply Reply Quote 0
          • B
            bloop last edited by

            @michihorn dann wirst du dich erst einmal etwas mit Flux auseinander setzen müssen.
            Lässt sich aber recht einfach über die Weboberfläche von Influx aufrufen. (:8086)
            Dort im Datenmonitor den gespeicherten Datensatz auswählen, konfigurieren und den im SkriptEditor angezeigten Code kopieren und in Grafana einfügen.
            Auf einen Tag gruppieren macht dir:

            aggregateWindow(every:1d, offset:-2h, fn:last, timesrc:“_start“)
            
            M 1 Reply Last reply Reply Quote 0
            • M
              michihorn @bloop last edited by michihorn

              @bloop sagte in Grafana:

              aggregateWindow(every:1d, offset:-2h, fn:last, timesrc:“_start“)

              Wo genau im Script lege ich Deinen Tag ab?
              So sieht mein Script im influx aus

              Ich bekomme auf dem Vorschauscreen den Hinweis:

              from(bucket: "iobroker")
                |> range(start: v.timeRangeStart, stop: v.timeRangeStop)
                |> filter(fn: (r) => r["_measurement"] == "hm-rega.0.43357")
                |> filter(fn: (r) => r["_field"] == "value")
                |> aggregateWindow(every:1d, offset:-2h, fn:last, timesrc:“_start“)
              

              Bar charts requires a string or time field
              bild2.png

              B 1 Reply Last reply Reply Quote 0
              • B
                bloop @michihorn last edited by

                @michihorn

                import "timezone"
                option location = timezone.location(name: "Europe/Berlin")
                
                from(bucket: "iobroker")
                 |> range(start: v.timeRangeStart, stop: v.timeRangeStop)
                 |> filter(fn: (r) => r["_measurement"] == "hm-rega.0.1603")
                 |> filter(fn: (r) => r["_field"] == "value")
                 |> aggregateWindow(every: 1d, offset:-3d1s, fn: last, createEmpty: false)
                 |> yield(name: "mean")
                

                dee9f8d8-06ce-4ddb-aa84-1902f8298019-image.png

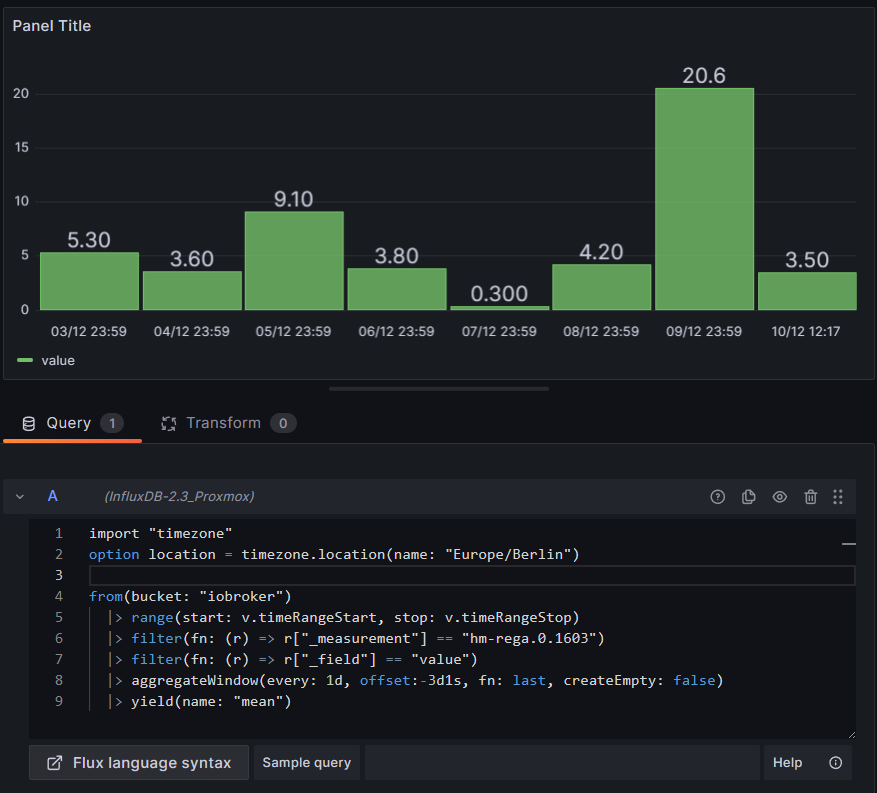
                Wie geschrieben, am besten den Code in Influx for konfigurieren und dann copy/paste nach Grafana.

                Ebenfalls zu empfehlen:
                https://university.influxdata.com/

                M 1 Reply Last reply Reply Quote 1
                • M
                  michihorn @bloop last edited by

                  @bloop sagte in Grafana:

                  import "timezone" option location = timezone.location(name: "Europe/Berlin")

                  Könntest Du mir noch sagen wie du die Zeit- Achse im Deutschen Format hinbekommen hast?
                  Bei mir ist der Monat noch zuerst geführt

                  B Homoran 2 Replies Last reply Reply Quote 0
                  • B
                    bloop @michihorn last edited by

                    @michihorn ufff das ist schon einige Zeit her. Ich glaube das war in der Grafana config Datei zum einstellen.

                    1 Reply Last reply Reply Quote 0
                    • Marc Berg
                      Marc Berg Most Active last edited by

                      @michihorn sagte in Grafana:

                      Könntest Du mir noch sagen wie du die Zeit- Achse im Deutschen Format hinbekommen hast?
                      Bei mir ist der Monat noch zuerst geführt

                      da gibts einen eigenen Abschnitt in der grafana.ini

                      [date_formats]
                      # For information on what formatting patterns that are supported https://momentjs.com/docs/#/displaying/
                      
                      # Default system date format used in time range picker and other places where full time is displayed
                      full_date = DD.MM.YYYY HH:mm:ss
                      
                      # Used by graph and other places where we only show small intervals
                      interval_second = HH:mm:ss
                      interval_minute = HH:mm
                      interval_hour = DD.MM. HH:mm
                      interval_day = DD.MM.
                      interval_month = MM.YYYY
                      interval_year = YYYY
                      
                      
                      1 Reply Last reply Reply Quote 1
                      • Homoran
                        Homoran Global Moderator Administrators @michihorn last edited by

                        @michihorn

                        @homoran sagte in Grafana:

                        @michihorn Bitte Threadtitel sinnvoll anpassen!

                        1 Reply Last reply Reply Quote 0
                        • First post
                          Last post

                        Support us

                        ioBroker
                        Community Adapters
                        Donate

                        1.1k
                        Online

                        31.7k
                        Users

                        79.7k
                        Topics

                        1.3m
                        Posts

                        4
                        11
                        829
                        Loading More Posts
                        • Oldest to Newest
                        • Newest to Oldest
                        • Most Votes
                        Reply
                        • Reply as topic
                        Log in to reply
                        Community
                        Impressum | Datenschutz-Bestimmungen | Nutzungsbedingungen
                        The ioBroker Community 2014-2023
                        logo