Navigation

    Logo
    • Register
    • Login
    • Search
    • Recent
    • Tags
    • Unread
    • Categories
    • Unreplied
    • Popular
    • GitHub
    • Docu
    • Hilfe
    1. Home
    2. Deutsch
    3. Off Topic
    4. Grafana
    5. Grafana Dashboards in VIS einbinden,

    NEWS

    • ioBroker@Smart Living Forum Solingen, 14.06. - Agenda added

    • ioBroker goes Matter ... Matter Adapter in Stable

    • Monatsrückblick - April 2025

    Grafana Dashboards in VIS einbinden,

    This topic has been deleted. Only users with topic management privileges can see it.
    • M
      Matze 3 last edited by

      Hallo Leute,

      ich möchte gerne meine Dashboards in der VIS (ioBroker) darstellen.

      Ich suche schon einige Zeit nach einer Lösung und komme immer wieder zu dem Punkt, dass ich die grafana.ini ändern muss.
      Und genau da komme ich nicht weiter.

      Bei mir läuft Grafana, ioBroker und influxdb auf einer Synology NAS im Container Manager (im Bridge Mode).

      Soweit wie ich das verstehe, kann ich über das Terminal vom MAC irgendwie die grafana.ini Datei öffnen und bearbeiten.

      Kann mir jemand Schritt für Schritt erklären was genau ich da machen muss bzw. eingeben muss????

      Vielen Dank

      B Glasfaser 2 Replies Last reply Reply Quote 0
      • B
        bloop @Matze 3 last edited by

        @matze-3
        Bei mir befindet sich ich die grafana.ini an folgendem pfad:

        cd /etc/grafana
        

        die config Datei öffnest du mit:

        sudo nano grafana.ini
        

        und suchst nach der Einstellung allow_embedding diese ist unter Security zu finden.
        Dann auf true stellen.

        [security]
        allow_embedding = true
        

        Um deine Visualisationen auch ohne Login auszuzeigen muss noch

        [auth.anonymous]
        enabled = true
        

        und

        [users]
        allow_sign_up = false
        

        aktiviert werden.
        Datei speichern mit strg + X und Y

        Dann Grafana neu starten

        sudo systemctl restart grafana-server 
        

        Um deine Visualisation (nicht das gesamte Dashboard) jetzt in die VIS einzubetten musst du in der VIS ein html Widget erstellen und darin die URL aus Share / Embed einfügen.
        z.b.

        <iframe src="http://192.168.0.103:3000/d-solo/SXfGCUZRk/home?orgId=1&from=1705119321458&to=1705140921458&panelId=4" width="450" height="200" frameborder="0"></iframe>
        

        anschließend muss die Größe sowohl in VIS als auch in Grafana angepasst werden.
        (width, height in der URL)

        M 1 Reply Last reply Reply Quote 1
        • M
          Matze 3 @bloop last edited by

          @bloop

          Vielen Dank für Deine Zeit...

          leider bekomme ich diese Meldung
          Bildschirmfoto 2024-01-13 um 14.30.44.png
          gebe ich das ein
          Bildschirmfoto 2024-01-13 um 14.32.25.png
          muss ich noch mein Passwort eingeben und danach kommt dieses Fenster
          Bildschirmfoto 2024-01-13 um 14.34.58.png

          hast Du eine Idee???

          B 1 Reply Last reply Reply Quote 0
          • B
            bloop @Matze 3 last edited by bloop

            @matze-3
            Wie und wo hast du Grafana installiert?
            ggf. in Docker Container? damit kenne ich mich leider zu wenig aus.

            Grundsätzlich musst du lediglich die grafana.ini finden und entsprechend anpassen.
            Da ich mich aber mit Containern nicht auskenne kann ich dir dann leider nicht sagen wo die config abgelegt wird.

            M 1 Reply Last reply Reply Quote 0
            • M
              Matze 3 @bloop last edited by

              @bloop

              genau, Grafana ist im Container Manager (Docker) installiert...
              ich bin zwar mittlerweile mit SSH auf der NAS, finde aber keinen Grafana Ordner bzw. auch keine grafana.ini Datei...

              Mist! Trotzdem vielen Dank für Deine Bemühungen.

              1 Reply Last reply Reply Quote 0
              • Glasfaser
                Glasfaser @Matze 3 last edited by Glasfaser

                @matze-3

                auf einer Synology NAS im Container Manager

                Den Ordner Mounten , sonst sind deine Einstellungen bei einem Upgrade von Grafana im Container weg , ist genau das gleiche wie bei ioBroker !

                also :

                21ff35d1-f720-4429-a90c-d6897a3a7797-grafik.png

                Grafana Container stoppen , dann unter Bearbeiten / Einstellungen kannst du es nachtragen

                dann kannst du die grafana.ini auch bearbeiten.

                f35a976e-73a9-4c19-8e8e-e0d08337582d-grafik.png

                .
                22fc399d-e463-4d46-815c-a6301babbb81-grafik.png

                Wenn du keine Text Editor hast , dann nachinstallieren :
                .
                8ce3ced8-b793-4e4a-bde2-99702bb8843a-grafik.png

                M 1 Reply Last reply Reply Quote 0
                • M
                  Matze 3 @Glasfaser last edited by

                  @glasfaser

                  das wäre ja viel zu einfach, wenn das klappen würde 🙂
                  Nachdem die Ordner hinzugefügt wurden hatte ich keine Datei im Config Ordner.
                  Also hab ich den Container mal gestartet, dieser hat dann sofort wieder gestoppt.

                  Bildschirmfoto 2024-01-13 um 18.22.56.png

                  Nehme ich die beiden wieder raus, funktioniert Grafana wieder.

                  Was ist da jetzt los?

                  Glasfaser 1 Reply Last reply Reply Quote 0
                  • Glasfaser
                    Glasfaser last edited by Glasfaser

                    @matze-3 sagte in Grafana Dashboards in VIS einbinden,:

                    Was ist da jetzt los?

                    eine Vorlage fehlt , als grafana.ini , denn Grafana schaut dort rein und startet von dort

                    ich dachte du hast schon eine Vorlage !?

                    https://fossies.org/linux/grafana/conf/defaults.ini

                    1 Reply Last reply Reply Quote 0
                    • Glasfaser
                      Glasfaser @Matze 3 last edited by

                      @matze-3 sagte in Grafana Dashboards in VIS einbinden,:

                      Nachdem die Ordner hinzugefügt wurden

                      ich habe dir estmal nur ein Ordner zum Mounten genannt/ gezeigt !

                      M 1 Reply Last reply Reply Quote 0
                      • M
                        Matze 3 @Glasfaser last edited by

                        @glasfaser

                        verstehe ich das richtig?

                        den Ordner Mounten in den Config Ordner die bearbeitete ini Datei (als "defaults.ini" oder "grafana.ini" ??) danach Grafana starten?

                        Muss ich sonst noch auf etwas achten bzw. in der Datei anpassen? Passwort oder so?

                        Glasfaser 1 Reply Last reply Reply Quote 0
                        • Glasfaser
                          Glasfaser @Matze 3 last edited by Glasfaser

                          @matze-3 sagte in Grafana Dashboards in VIS einbinden,:

                          Muss ich sonst noch auf etwas achten bzw. in der Datei anpassen? Passwort oder so?

                          So wie @bloop es dir vorgibt !

                          Ich habe es mal für dich angepasst

                          Vorlage für Docker :

                          ##################### Grafana Configuration Example #####################
                          #
                          # Everything has defaults so you only need to uncomment things you want to
                          # change
                          
                          # possible values : production, development
                          ;app_mode = production
                          
                          # instance name, defaults to HOSTNAME environment variable value or hostname if HOSTNAME var is empty
                          ;instance_name = ${HOSTNAME}
                          
                          #################################### Paths ####################################
                          [paths]
                          # Path to where grafana can store temp files, sessions, and the sqlite3 db (if that is used)
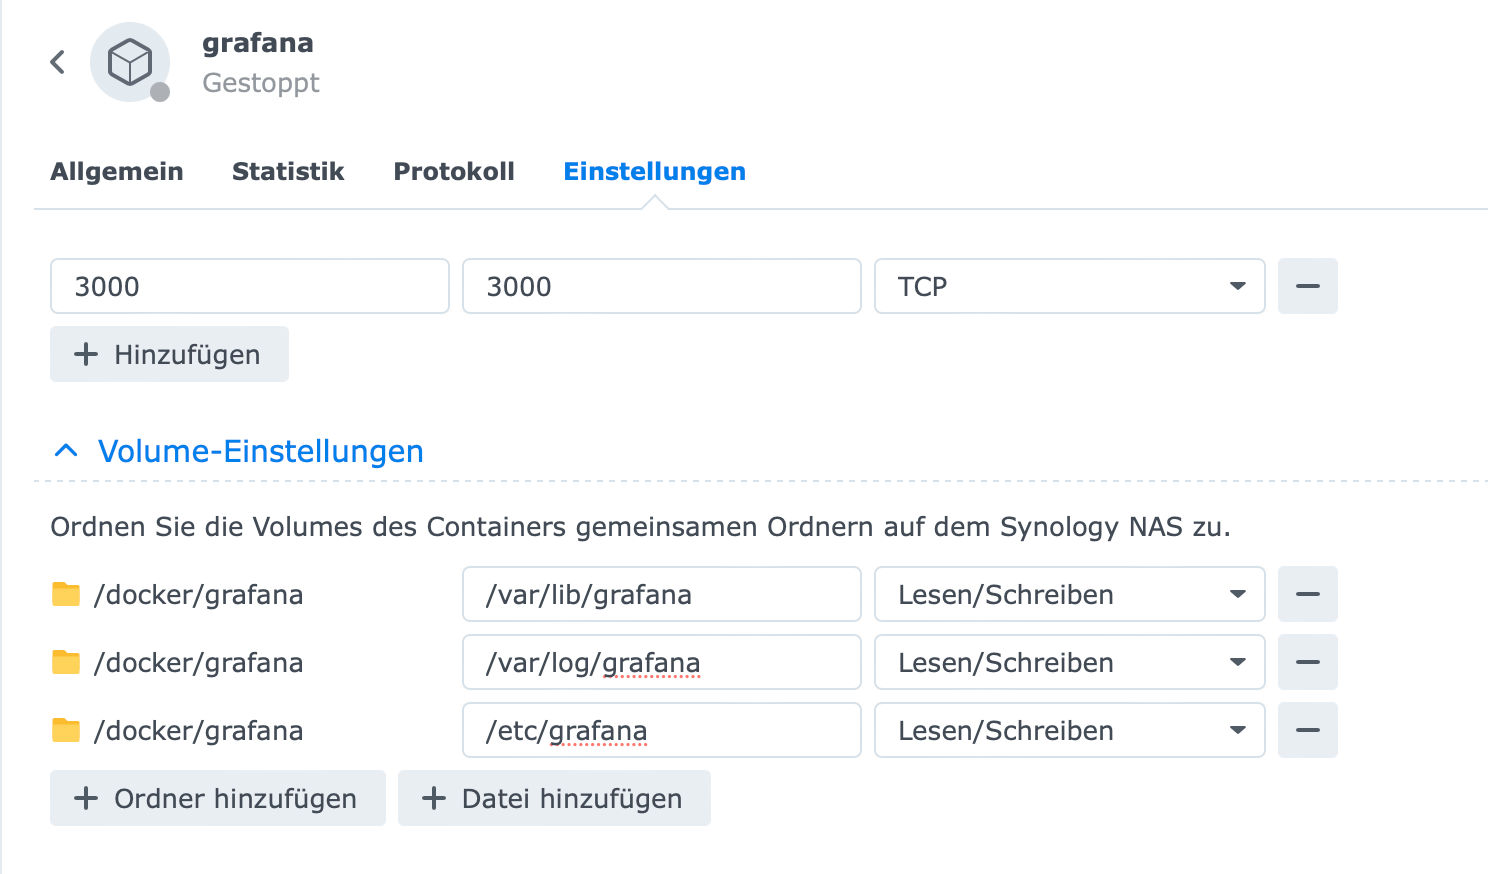
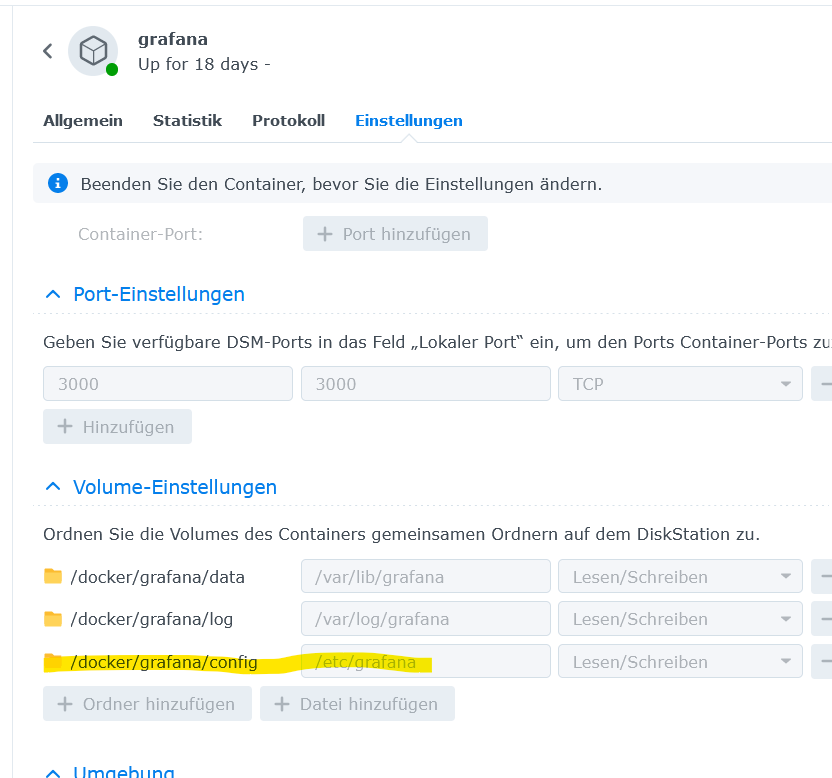
                          ;data = /var/lib/grafana
                          
                          # Temporary files in `data` directory older than given duration will be removed
                          ;temp_data_lifetime = 24h
                          
                          # Directory where grafana can store logs
                          ;logs = /var/log/grafana
                          
                          # Directory where grafana will automatically scan and look for plugins
                          ;plugins = /var/lib/grafana/plugins
                          
                          # folder that contains provisioning config files that grafana will apply on startup and while running.
                          ;provisioning = conf/provisioning
                          
                          #################################### Server ####################################
                          [server]
                          # Protocol (http, https, h2, socket)
                          ;protocol = http
                          
                          # The ip address to bind to, empty will bind to all interfaces
                          ;http_addr =
                          
                          # The http port  to use
                          ;http_port = 3000
                          
                          # The public facing domain name used to access grafana from a browser
                          ;domain = localhost
                          
                          # Redirect to correct domain if host header does not match domain
                          # Prevents DNS rebinding attacks
                          ;enforce_domain = false
                          
                          # The full public facing url you use in browser, used for redirects and emails
                          # If you use reverse proxy and sub path specify full url (with sub path)
                          ;root_url = %(protocol)s://%(domain)s:%(http_port)s/
                          
                          # Serve Grafana from subpath specified in `root_url` setting. By default it is set to `false` for compatibility reasons.
                          ;serve_from_sub_path = false
                          
                          # Log web requests
                          ;router_logging = false
                          
                          # the path relative working path
                          ;static_root_path = public
                          
                          # enable gzip
                          ;enable_gzip = false
                          
                          # https certs & key file
                          ;cert_file =
                          ;cert_key =
                          
                          # Unix socket path
                          ;socket =
                          
                          #################################### Database ####################################
                          [database]
                          # You can configure the database connection by specifying type, host, name, user and password
                          # as separate properties or as on string using the url properties.
                          
                          # Either "mysql", "postgres" or "sqlite3", it's your choice
                          ;type = sqlite3
                          ;host = 127.0.0.1:3306
                          ;name = grafana
                          ;user = root
                          # If the password contains # or ; you have to wrap it with triple quotes. Ex """#password;"""
                          ;password =
                          
                          # Use either URL or the previous fields to configure the database
                          # Example: mysql://user:secret@host:port/database
                          ;url =
                          
                          # For "postgres" only, either "disable", "require" or "verify-full"
                          ;ssl_mode = disable
                          
                          ;ca_cert_path =
                          ;client_key_path =
                          ;client_cert_path =
                          ;server_cert_name =
                          
                          # For "sqlite3" only, path relative to data_path setting
                          ;path = grafana.db
                          
                          # Max idle conn setting default is 2
                          ;max_idle_conn = 2
                          
                          # Max conn setting default is 0 (mean not set)
                          ;max_open_conn =
                          
                          # Connection Max Lifetime default is 14400 (means 14400 seconds or 4 hours)
                          ;conn_max_lifetime = 14400
                          
                          # Set to true to log the sql calls and execution times.
                          ;log_queries =
                          
                          # For "sqlite3" only. cache mode setting used for connecting to the database. (private, shared)
                          ;cache_mode = private
                          
                          #################################### Cache server #############################
                          [remote_cache]
                          # Either "redis", "memcached" or "database" default is "database"
                          ;type = database
                          
                          # cache connectionstring options
                          # database: will use Grafana primary database.
                          # redis: config like redis server e.g. `addr=127.0.0.1:6379,pool_size=100,db=0,ssl=false`. Only addr is required. ssl may be 'true', 'false', or 'insecure'.
                          # memcache: 127.0.0.1:11211
                          ;connstr =
                          
                          #################################### Data proxy ###########################
                          [dataproxy]
                          
                          # This enables data proxy logging, default is false
                          ;logging = false
                          
                          # How long the data proxy should wait before timing out default is 30 (seconds)
                          ;timeout = 30
                          
                          # If enabled and user is not anonymous, data proxy will add X-Grafana-User header with username into the request, default is false.
                          ;send_user_header = false
                          
                          #################################### Analytics ####################################
                          [analytics]
                          # Server reporting, sends usage counters to stats.grafana.org every 24 hours.
                          # No ip addresses are being tracked, only simple counters to track
                          # running instances, dashboard and error counts. It is very helpful to us.
                          # Change this option to false to disable reporting.
                          ;reporting_enabled = true
                          
                          # Set to false to disable all checks to https://grafana.net
                          # for new vesions (grafana itself and plugins), check is used
                          # in some UI views to notify that grafana or plugin update exists
                          # This option does not cause any auto updates, nor send any information
                          # only a GET request to http://grafana.com to get latest versions
                          ;check_for_updates = true
                          
                          # Google Analytics universal tracking code, only enabled if you specify an id here
                          ;google_analytics_ua_id =
                          
                          # Google Tag Manager ID, only enabled if you specify an id here
                          ;google_tag_manager_id =
                          
                          #################################### Security ####################################
                          [security]
                          # disable creation of admin user on first start of grafana
                          ;disable_initial_admin_creation = false
                          
                          # default admin user, created on startup
                          ;admin_user = admin
                          
                          # default admin password, can be changed before first start of grafana,  or in profile settings
                          ;admin_password = """password"""
                          
                          # used for signing
                          ;secret_key = SW2YcwTIb9zpOOhoPsMm
                          
                          # disable gravatar profile images
                          ;disable_gravatar = false
                          
                          # data source proxy whitelist (ip_or_domain:port separated by spaces)
                          ;data_source_proxy_whitelist =
                          
                          # disable protection against brute force login attempts
                          ;disable_brute_force_login_protection = false
                          
                          # set to true if you host Grafana behind HTTPS. default is false.
                          ;cookie_secure = false
                          
                          # set cookie SameSite attribute. defaults to `lax`. can be set to "lax", "strict", "none" and "disabled"
                          ;cookie_samesite = lax
                          
                          # set to true if you want to allow browsers to render Grafana in a <frame>, <iframe>, <embed> or <object>. default is false.
                          allow_embedding = true
                          
                          # Set to true if you want to enable http strict transport security (HSTS) response header.
                          # This is only sent when HTTPS is enabled in this configuration.
                          # HSTS tells browsers that the site should only be accessed using HTTPS.
                          # The default version will change to true in the next minor release, 6.3.
                          ;strict_transport_security = false
                          
                          # Sets how long a browser should cache HSTS. Only applied if strict_transport_security is enabled.
                          ;strict_transport_security_max_age_seconds = 86400
                          
                          # Set to true if to enable HSTS preloading option. Only applied if strict_transport_security is enabled.
                          ;strict_transport_security_preload = false
                          
                          # Set to true if to enable the HSTS includeSubDomains option. Only applied if strict_transport_security is enabled.
                          ;strict_transport_security_subdomains = false
                          
                          # Set to true to enable the X-Content-Type-Options response header.
                          # The X-Content-Type-Options response HTTP header is a marker used by the server to indicate that the MIME types advertised
                          # in the Content-Type headers should not be changed and be followed. The default will change to true in the next minor release, 6.3.
                          ;x_content_type_options = false
                          
                          # Set to true to enable the X-XSS-Protection header, which tells browsers to stop pages from loading
                          # when they detect reflected cross-site scripting (XSS) attacks. The default will change to true in the next minor release, 6.3.
                          ;x_xss_protection = false
                          
                          #################################### Snapshots ###########################
                          [snapshots]
                          # snapshot sharing options
                          ;external_enabled = true
                          ;external_snapshot_url = https://snapshots-origin.raintank.io
                          ;external_snapshot_name = Publish to snapshot.raintank.io
                          
                          # Set to true to enable this Grafana instance act as an external snapshot server and allow unauthenticated requests for
                          # creating and deleting snapshots.
                          ;public_mode = false
                          
                          # remove expired snapshot
                          ;snapshot_remove_expired = true
                          
                          #################################### Dashboards History ##################
                          [dashboards]
                          # Number dashboard versions to keep (per dashboard). Default: 20, Minimum: 1
                          ;versions_to_keep = 20
                          
                          # Minimum dashboard refresh interval. When set, this will restrict users to set the refresh interval of a dashboard lower than given interval. Per default this is not set/unrestricted.
                          # The interval string is a possibly signed sequence of decimal numbers, followed by a unit suffix (ms, s, m, h, d), e.g. 30s or 1m.
                          ;min_refresh_interval =
                          
                          #################################### Users ###############################
                          [users]
                          # disable user signup / registration
                          allow_sign_up = true
                          
                          # Allow non admin users to create organizations
                          ;allow_org_create = true
                          
                          # Set to true to automatically assign new users to the default organization (id 1)
                          ;auto_assign_org = true
                          
                          # Set this value to automatically add new users to the provided organization (if auto_assign_org above is set to true)
                          ;auto_assign_org_id = 1
                          
                          # Default role new users will be automatically assigned (if disabled above is set to true)
                          ;auto_assign_org_role = Viewer
                          
                          # Require email validation before sign up completes
                          ;verify_email_enabled = false
                          
                          # Background text for the user field on the login page
                          ;login_hint = email or username
                          ;password_hint = password
                          
                          # Default UI theme ("dark" or "light")
                          ;default_theme = dark
                          
                          # External user management, these options affect the organization users view
                          ;external_manage_link_url =
                          ;external_manage_link_name =
                          ;external_manage_info =
                          
                          # Viewers can edit/inspect dashboard settings in the browser. But not save the dashboard.
                          ;viewers_can_edit = false
                          
                          # Editors can administrate dashboard, folders and teams they create
                          ;editors_can_admin = false
                          
                          [auth]
                          # Login cookie name
                          ;login_cookie_name = grafana_session
                          
                          # The lifetime (days) an authenticated user can be inactive before being required to login at next visit. Default is 7 days,
                          ;login_maximum_inactive_lifetime_days = 7
                          
                          # The maximum lifetime (days) an authenticated user can be logged in since login time before being required to login. Default is 30 days.
                          ;login_maximum_lifetime_days = 30
                          
                          # How often should auth tokens be rotated for authenticated users when being active. The default is each 10 minutes.
                          ;token_rotation_interval_minutes = 10
                          
                          # Set to true to disable (hide) the login form, useful if you use OAuth, defaults to false
                          ;disable_login_form = false
                          
                          # Set to true to disable the signout link in the side menu. useful if you use auth.proxy, defaults to false
                          ;disable_signout_menu = false
                          
                          # URL to redirect the user to after sign out
                          ;signout_redirect_url =
                          
                          # Set to true to attempt login with OAuth automatically, skipping the login screen.
                          # This setting is ignored if multiple OAuth providers are configured.
                          ;oauth_auto_login = false
                          
                          # limit of api_key seconds to live before expiration
                          ;api_key_max_seconds_to_live = -1
                          
                          #################################### Anonymous Auth ######################
                          [auth.anonymous]
                          # enable anonymous access
                          enabled = true
                          
                          # specify organization name that should be used for unauthenticated users
                          ;org_name = Main Org.
                          
                          # specify role for unauthenticated users
                          ;org_role = Viewer
                          
                          #################################### Github Auth ##########################
                          [auth.github]
                          ;enabled = false
                          ;allow_sign_up = true
                          ;client_id = some_id
                          ;client_secret = some_secret
                          ;scopes = user:email,read:org
                          ;auth_url = https://github.com/login/oauth/authorize
                          ;token_url = https://github.com/login/oauth/access_token
                          ;api_url = https://api.github.com/user
                          ;allowed_domains =
                          ;team_ids =
                          ;allowed_organizations =
                          
                          #################################### GitLab Auth #########################
                          [auth.gitlab]
                          ;enabled = false
                          ;allow_sign_up = true
                          ;client_id = some_id
                          ;client_secret = some_secret
                          ;scopes = api
                          ;auth_url = https://gitlab.com/oauth/authorize
                          ;token_url = https://gitlab.com/oauth/token
                          ;api_url = https://gitlab.com/api/v4
                          ;allowed_domains =
                          ;allowed_groups =
                          
                          #################################### Google Auth ##########################
                          [auth.google]
                          ;enabled = false
                          ;allow_sign_up = true
                          ;client_id = some_client_id
                          ;client_secret = some_client_secret
                          ;scopes = https://www.googleapis.com/auth/userinfo.profile https://www.googleapis.com/auth/userinfo.email
                          ;auth_url = https://accounts.google.com/o/oauth2/auth
                          ;token_url = https://accounts.google.com/o/oauth2/token
                          ;api_url = https://www.googleapis.com/oauth2/v1/userinfo
                          ;allowed_domains =
                          ;hosted_domain =
                          
                          #################################### Grafana.com Auth ####################
                          [auth.grafana_com]
                          ;enabled = false
                          ;allow_sign_up = true
                          ;client_id = some_id
                          ;client_secret = some_secret
                          ;scopes = user:email
                          ;allowed_organizations =
                          
                          #################################### Azure AD OAuth #######################
                          [auth.azuread]
                          ;name = Azure AD
                          ;enabled = false
                          ;allow_sign_up = true
                          ;client_id = some_client_id
                          ;client_secret = some_client_secret
                          ;scopes = openid email profile
                          ;auth_url = https://login.microsoftonline.com/<tenant-id>/oauth2/v2.0/authorize
                          ;token_url = https://login.microsoftonline.com/<tenant-id>/oauth2/v2.0/token
                          ;allowed_domains =
                          ;allowed_groups =
                          
                          #################################### Generic OAuth ##########################
                          [auth.generic_oauth]
                          ;enabled = false
                          ;name = OAuth
                          ;allow_sign_up = true
                          ;client_id = some_id
                          ;client_secret = some_secret
                          ;scopes = user:email,read:org
                          ;email_attribute_name = email:primary
                          ;email_attribute_path =
                          ;auth_url = https://foo.bar/login/oauth/authorize
                          ;token_url = https://foo.bar/login/oauth/access_token
                          ;api_url = https://foo.bar/user
                          ;allowed_domains =
                          ;team_ids =
                          ;allowed_organizations =
                          ;role_attribute_path =
                          ;tls_skip_verify_insecure = false
                          ;tls_client_cert =
                          ;tls_client_key =
                          ;tls_client_ca =
                          
                          #################################### SAML Auth ###########################
                          [auth.saml] # Enterprise only
                          # Defaults to false. If true, the feature is enabled.
                          ;enabled = false
                          
                          # Base64-encoded public X.509 certificate. Used to sign requests to the IdP
                          ;certificate =
                          
                          # Path to the public X.509 certificate. Used to sign requests to the IdP
                          ;certificate_path =
                          
                          # Base64-encoded private key. Used to decrypt assertions from the IdP
                          ;private_key =
                          
                          ;# Path to the private key. Used to decrypt assertions from the IdP
                          ;private_key_path =
                          
                          # Base64-encoded IdP SAML metadata XML. Used to verify and obtain binding locations from the IdP
                          ;idp_metadata =
                          
                          # Path to the SAML metadata XML. Used to verify and obtain binding locations from the IdP
                          ;idp_metadata_path =
                          
                          # URL to fetch SAML IdP metadata. Used to verify and obtain binding locations from the IdP
                          ;idp_metadata_url =
                          
                          # Duration, since the IdP issued a response and the SP is allowed to process it. Defaults to 90 seconds.
                          ;max_issue_delay = 90s
                          
                          # Duration, for how long the SP's metadata should be valid. Defaults to 48 hours.
                          ;metadata_valid_duration = 48h
                          
                          # Friendly name or name of the attribute within the SAML assertion to use as the user's name
                          ;assertion_attribute_name = displayName
                          
                          # Friendly name or name of the attribute within the SAML assertion to use as the user's login handle
                          ;assertion_attribute_login = mail
                          
                          # Friendly name or name of the attribute within the SAML assertion to use as the user's email
                          ;assertion_attribute_email = mail
                          
                          #################################### Basic Auth ##########################
                          [auth.basic]
                          ;enabled = true
                          
                          #################################### Auth Proxy ##########################
                          [auth.proxy]
                          ;enabled = false
                          ;header_name = X-WEBAUTH-USER
                          ;header_property = username
                          ;auto_sign_up = true
                          ;sync_ttl = 60
                          ;whitelist = 192.168.1.1, 192.168.2.1
                          ;headers = Email:X-User-Email, Name:X-User-Name
                          # Read the auth proxy docs for details on what the setting below enables
                          ;enable_login_token = false
                          
                          #################################### Auth LDAP ##########################
                          [auth.ldap]
                          ;enabled = false
                          ;config_file = /etc/grafana/ldap.toml
                          ;allow_sign_up = true
                          
                          # LDAP backround sync (Enterprise only)
                          # At 1 am every day
                          ;sync_cron = "0 0 1 * * *"
                          ;active_sync_enabled = true
                          
                          #################################### SMTP / Emailing ##########################
                          [smtp]
                          ; enabled = true
                          ; host = smtp
                          ; user =  
                          # If the password contains # or ; you have to wrap it with triple quotes. Ex """#password;"""
                          ;password = 
                          ;cert_file =
                          ;key_file =
                          ; skip_verify = true
                          ; from_address = 
                          ; from_name = 
                          # EHLO identity in SMTP dialog (defaults to instance_name)
                          ;ehlo_identity = dashboard.example.com
                          
                          [emails]
                          ;welcome_email_on_sign_up = false
                          ;templates_pattern = emails/*.html
                          
                          #################################### Logging ##########################
                          [log]
                          # Either "console", "file", "syslog". Default is console and  file
                          # Use space to separate multiple modes, e.g. "console file"
                          ;mode = console file
                          
                          # Either "debug", "info", "warn", "error", "critical", default is "info"
                          ;level = info
                          
                          # optional settings to set different levels for specific loggers. Ex filters = sqlstore:debug
                          ;filters =
                          
                          # For "console" mode only
                          [log.console]
                          ;level =
                          
                          # log line format, valid options are text, console and json
                          ;format = console
                          
                          # For "file" mode only
                          [log.file]
                          ;level =
                          
                          # log line format, valid options are text, console and json
                          ;format = text
                          
                          # This enables automated log rotate(switch of following options), default is true
                          ;log_rotate = true
                          
                          # Max line number of single file, default is 1000000
                          ;max_lines = 1000000
                          
                          # Max size shift of single file, default is 28 means 1 << 28, 256MB
                          ;max_size_shift = 28
                          
                          # Segment log daily, default is true
                          ;daily_rotate = true
                          
                          # Expired days of log file(delete after max days), default is 7
                          ;max_days = 7
                          
                          [log.syslog]
                          ;level =
                          
                          # log line format, valid options are text, console and json
                          ;format = text
                          
                          # Syslog network type and address. This can be udp, tcp, or unix. If left blank, the default unix endpoints will be used.
                          ;network =
                          ;address =
                          
                          # Syslog facility. user, daemon and local0 through local7 are valid.
                          ;facility =
                          
                          # Syslog tag. By default, the process' argv[0] is used.
                          ;tag =
                          
                          #################################### Usage Quotas ########################
                          [quota]
                          ; enabled = false
                          
                          #### set quotas to -1 to make unlimited. ####
                          # limit number of users per Org.
                          ; org_user = 10
                          
                          # limit number of dashboards per Org.
                          ; org_dashboard = 100
                          
                          # limit number of data_sources per Org.
                          ; org_data_source = 10
                          
                          # limit number of api_keys per Org.
                          ; org_api_key = 10
                          
                          # limit number of orgs a user can create.
                          ; user_org = 10
                          
                          # Global limit of users.
                          ; global_user = -1
                          
                          # global limit of orgs.
                          ; global_org = -1
                          
                          # global limit of dashboards
                          ; global_dashboard = -1
                          
                          # global limit of api_keys
                          ; global_api_key = -1
                          
                          # global limit on number of logged in users.
                          ; global_session = -1
                          
                          #################################### Alerting ############################
                          [alerting]
                          # Disable alerting engine & UI features
                          ;enabled = true
                          # Makes it possible to turn off alert rule execution but alerting UI is visible
                          ;execute_alerts = true
                          
                          # Default setting for new alert rules. Defaults to categorize error and timeouts as alerting. (alerting, keep_state)
                          ;error_or_timeout = alerting
                          
                          # Default setting for how Grafana handles nodata or null values in alerting. (alerting, no_data, keep_state, ok)
                          ;nodata_or_nullvalues = no_data
                          
                          # Alert notifications can include images, but rendering many images at the same time can overload the server
                          # This limit will protect the server from render overloading and make sure notifications are sent out quickly
                          ;concurrent_render_limit = 5
                          
                          
                          # Default setting for alert calculation timeout. Default value is 30
                          ;evaluation_timeout_seconds = 30
                          
                          # Default setting for alert notification timeout. Default value is 30
                          ;notification_timeout_seconds = 30
                          
                          # Default setting for max attempts to sending alert notifications. Default value is 3
                          ;max_attempts = 3
                          
                          # Makes it possible to enforce a minimal interval between evaluations, to reduce load on the backend
                          ;min_interval_seconds = 1
                          
                          #################################### Explore #############################
                          [explore]
                          # Enable the Explore section
                          ;enabled = true
                          
                          #################################### Internal Grafana Metrics ##########################
                          # Metrics available at HTTP API Url /metrics
                          [metrics]
                          # Disable / Enable internal metrics
                          ;enabled           = true
                          # Graphite Publish interval
                          ;interval_seconds  = 10
                          # Disable total stats (stat_totals_*) metrics to be generated
                          ;disable_total_stats = false
                          
                          #If both are set, basic auth will be required for the metrics endpoint.
                          ; basic_auth_username =
                          ; basic_auth_password =
                          
                          # Send internal metrics to Graphite
                          [metrics.graphite]
                          # Enable by setting the address setting (ex localhost:2003)
                          ;address =
                          ;prefix = prod.grafana.%(instance_name)s.
                          
                          #################################### Grafana.com integration  ##########################
                          # Url used to import dashboards directly from Grafana.com
                          [grafana_com]
                          ;url = https://grafana.com
                          
                          #################################### Distributed tracing ############
                          [tracing.jaeger]
                          # Enable by setting the address sending traces to jaeger (ex localhost:6831)
                          ;address = localhost:6831
                          # Tag that will always be included in when creating new spans. ex (tag1:value1,tag2:value2)
                          ;always_included_tag = tag1:value1
                          # Type specifies the type of the sampler: const, probabilistic, rateLimiting, or remote
                          ;sampler_type = const
                          # jaeger samplerconfig param
                          # for "const" sampler, 0 or 1 for always false/true respectively
                          # for "probabilistic" sampler, a probability between 0 and 1
                          # for "rateLimiting" sampler, the number of spans per second
                          # for "remote" sampler, param is the same as for "probabilistic"
                          # and indicates the initial sampling rate before the actual one
                          # is received from the mothership
                          ;sampler_param = 1
                          # Whether or not to use Zipkin propagation (x-b3- HTTP headers).
                          ;zipkin_propagation = false
                          # Setting this to true disables shared RPC spans.
                          # Not disabling is the most common setting when using Zipkin elsewhere in your infrastructure.
                          ;disable_shared_zipkin_spans = false
                          
                          #################################### External image storage ##########################
                          [external_image_storage]
                          # Used for uploading images to public servers so they can be included in slack/email messages.
                          # you can choose between (s3, webdav, gcs, azure_blob, local)
                          ;provider =
                          
                          [external_image_storage.s3]
                          ;endpoint =
                          ;path_style_access =
                          ;bucket =
                          ;region =
                          ;path =
                          ;access_key =
                          ;secret_key =
                          
                          [external_image_storage.webdav]
                          ;url =
                          ;public_url =
                          ;username =
                          ;password =
                          
                          [external_image_storage.gcs]
                          ;key_file =
                          ;bucket =
                          ;path =
                          
                          [external_image_storage.azure_blob]
                          ;account_name =
                          ;account_key =
                          ;container_name =
                          
                          [external_image_storage.local]
                          # does not require any configuration
                          
                          [rendering]
                          # Options to configure a remote HTTP image rendering service, e.g. using https://github.com/grafana/grafana-image-renderer.
                          # URL to a remote HTTP image renderer service, e.g. http://localhost:8081/render, will enable Grafana to render panels and dashboards to PNG-images using HTTP requests to an external service.
                          ;server_url =
                          # If the remote HTTP image renderer service runs on a different server than the Grafana server you may have to configure this to a URL where Grafana is reachable, e.g. http://grafana.domain/.
                          ;callback_url =
                          
                          ;server_url = http://192.168.178.11:48081/render
                          ;callback_url = http://192.168.178.13:3001/
                          
                          [panels]
                          # If set to true Grafana will allow script tags in text panels. Not recommended as it enable XSS vulnerabilities.
                          ;disable_sanitize_html = false
                          
                          [plugins]
                          ;enable_alpha = false
                          ;app_tls_skip_verify_insecure = false
                          
                          [enterprise]
                          # Path to a valid Grafana Enterprise license.jwt file
                          ;license_path =
                          
                          [feature_toggles]
                          # enable features, separated by spaces
                          ;enable =


                          die bearbeitete ini Datei (als "defaults.ini" oder "grafana.ini" ??) danach Grafana starten?

                          ...die Vorlage von mir dann als grafana.ini

                          1 Reply Last reply Reply Quote 0
                          • M
                            Matze 3 last edited by

                            @glasfaser
                            @bloop

                            Prima, Danke Euch...
                            Das hat wieder einmal funktioniert...

                            1 Reply Last reply Reply Quote 0
                            • First post
                              Last post

                            Support us

                            ioBroker
                            Community Adapters
                            Donate

                            956
                            Online

                            31.7k
                            Users

                            79.7k
                            Topics

                            1.3m
                            Posts

                            container manager grafana synology nas vis
                            3
                            12
                            1091
                            Loading More Posts
                            • Oldest to Newest
                            • Newest to Oldest
                            • Most Votes
                            Reply
                            • Reply as topic
                            Log in to reply
                            Community
                            Impressum | Datenschutz-Bestimmungen | Nutzungsbedingungen
                            The ioBroker Community 2014-2023
                            logo