[Gelöst] Datenbankfehler - egal wie oft ich neu installiere
-
Hallo,
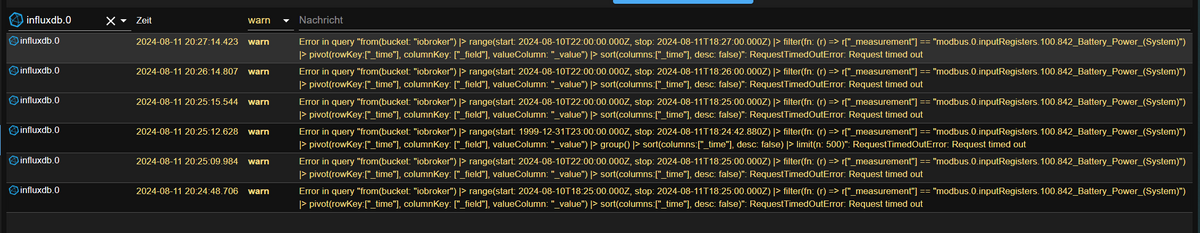
egal wie oft ich ioBroker installiere, irgendwann, nach gar nicht mal so langer Zeit, bekomme ich Fehler von der InfluxDB, wenn ich gespeicherte Daten ansehen will.
Der Speicherchip ist ein neuer A2.
Warum ist das so? Wie kann ich das reparieren? Was kann ich tun?Danke + MfG
der StefflNachtrag: Der Fehler wurde gefunden
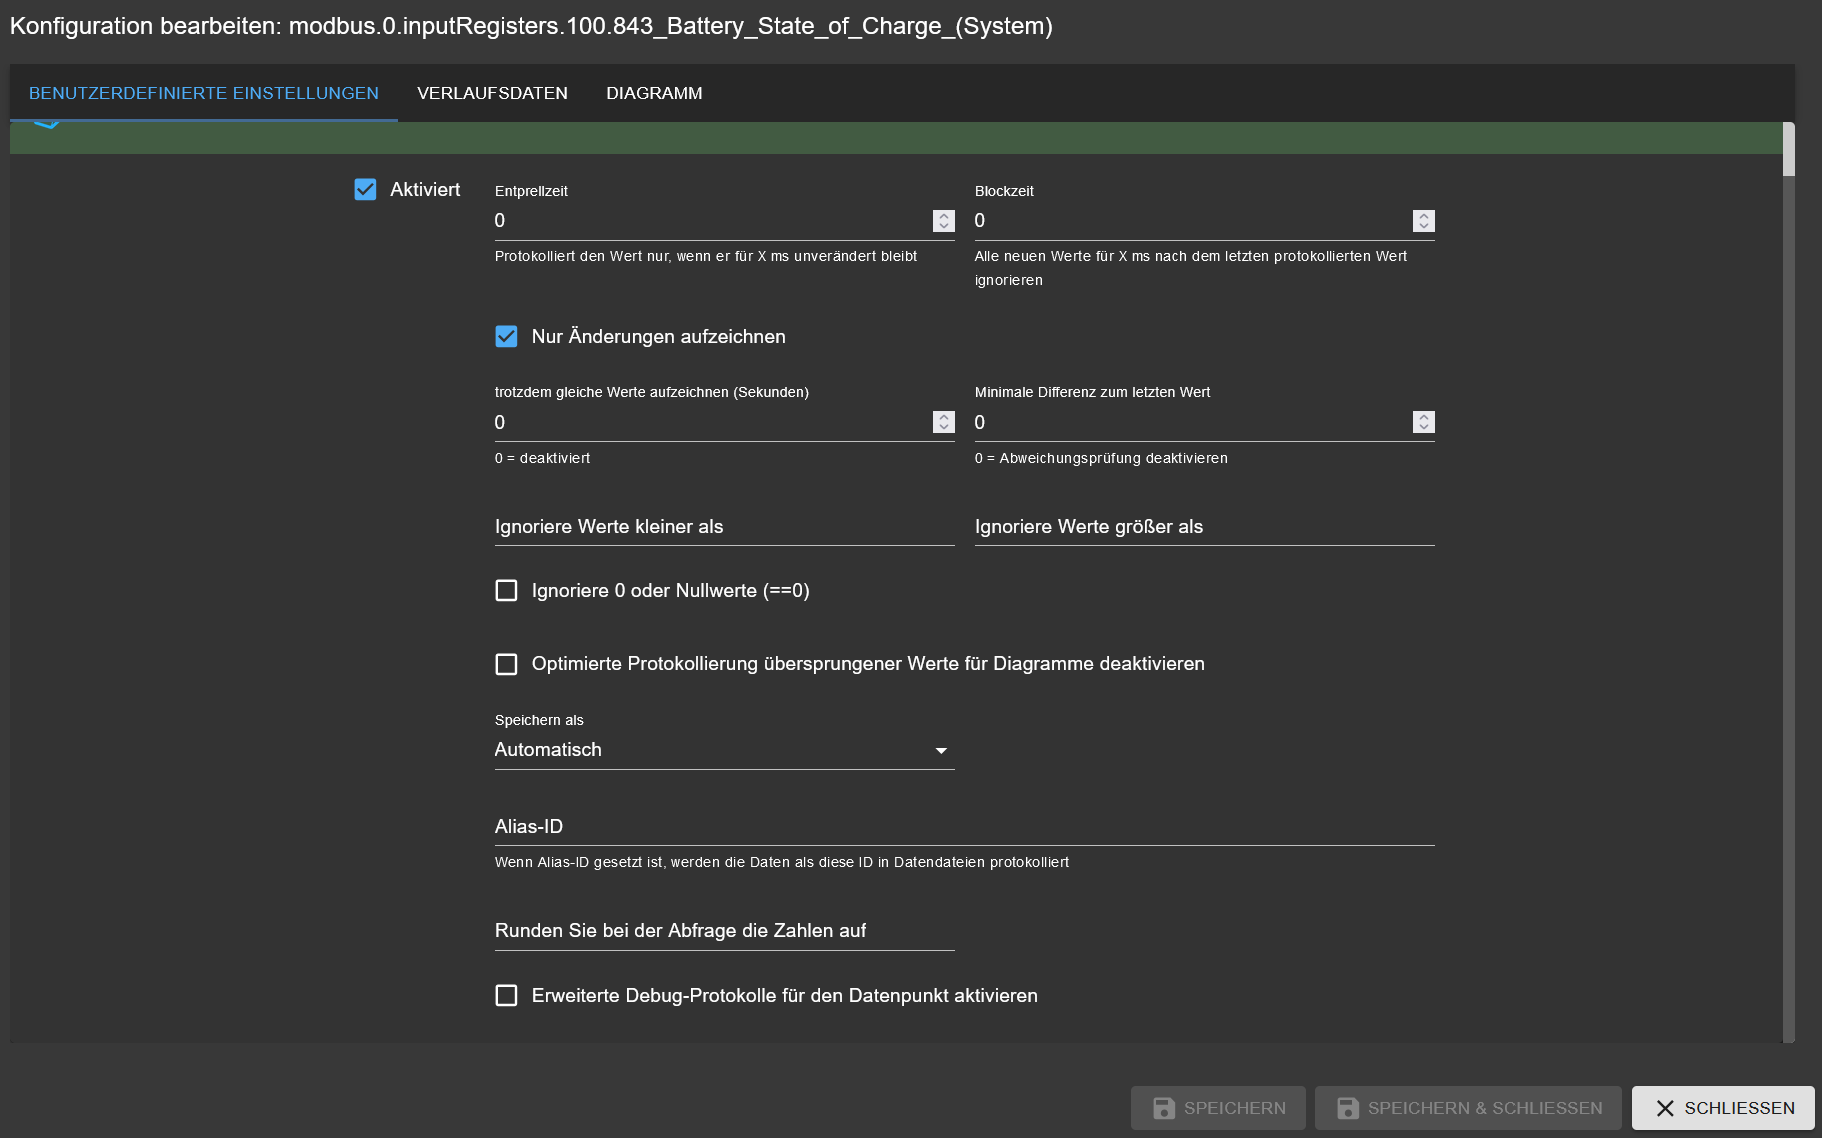
Das Problem waren einfach zuviele Datensätze. Bei der Datenbank wurden beim "Zahnrad" die Blockzeit immer auf 5000 bis 50000 gestellt, damit gibts dann auch wesentlich weniger Datensätze, aber noch ausreichend viele Datensätze. -
@stefan-falt du hast einen Timed Out erhalten. Irgendetwas bremst, blockiert.
Mach doch mal bitte ein
iob diagund poste ALLES in </>.
Ro75.
-
@ro75 said in Datenbankfehler - egal wie oft ich neu installiere:
iob diag
Hallo, danke für Deine Zeit.
======== Start marking the full check here ========= Skript v.2024-05-22 *** BASE SYSTEM *** Static hostname: raspberrypi Icon name: computer Operating System: Debian GNU/Linux 12 (bookworm) Kernel: Linux 6.6.31+rpt-rpi-v8 Architecture: arm64 Model : Raspberry Pi 4 Model B Rev 1.5 Docker : false Virtualization : none Kernel : aarch64 Userland : 64 bit Systemuptime and Load: 20:43:31 up 1 day, 21:38, 2 users, load average: 0.55, 0.41, 0.52 CPU threads: 4 *** RASPBERRY THROTTLING *** Current issues: No throttling issues detected. Previously detected issues: No throttling issues detected. *** Time and Time Zones *** Local time: Sun 2024-08-11 20:43:31 CEST Universal time: Sun 2024-08-11 18:43:31 UTC RTC time: n/a Time zone: Europe/Berlin (CEST, +0200) System clock synchronized: yes NTP service: active RTC in local TZ: no *** Users and Groups *** User that called 'iob diag': ioBroker HOME=/home/ioBroker GROUPS=ioBroker adm dialout cdrom sudo audio video plugdev games users input render netdev gpio i2c spi iobroker User that is running 'js-controller': iobroker HOME=/home/iobroker GROUPS=iobroker tty dialout audio video plugdev bluetooth gpio i2c *** Display-Server-Setup *** Display-Server: false Desktop: Terminal: tty Boot Target: multi-user.target *** MEMORY *** total used free shared buff/cache available Mem: 4.0G 1.7G 308M 1.2M 2.1G 2.3G Swap: 209M 0B 209M Total: 4.2G 1.7G 518M Active iob-Instances: 15 3792 M total memory 1577 M used memory 1657 M active memory 1622 M inactive memory 294 M free memory 103 M buffer memory 1893 M swap cache 199 M total swap 0 M used swap 199 M free swap *** top - Table Of Processes *** top - 20:43:31 up 1 day, 21:38, 2 users, load average: 0.55, 0.41, 0.52 Tasks: 181 total, 2 running, 179 sleeping, 0 stopped, 0 zombie %Cpu(s): 0.0 us, 16.7 sy, 0.0 ni, 83.3 id, 0.0 wa, 0.0 hi, 0.0 si, 0.0 st MiB Mem : 3792.1 total, 293.0 free, 1579.0 used, 1996.8 buff/cache MiB Swap: 200.0 total, 200.0 free, 0.0 used. 2213.0 avail Mem *** FAILED SERVICES *** UNIT LOAD ACTIVE SUB DESCRIPTION 0 loaded units listed. *** FILESYSTEM *** Filesystem Type Size Used Avail Use% Mounted on udev devtmpfs 1.6G 0 1.6G 0% /dev tmpfs tmpfs 380M 1.2M 379M 1% /run /dev/mmcblk0p2 ext4 117G 5.5G 106G 5% / tmpfs tmpfs 1.9G 0 1.9G 0% /dev/shm tmpfs tmpfs 5.0M 16K 5.0M 1% /run/lock /dev/mmcblk0p1 vfat 510M 64M 447M 13% /boot/firmware tmpfs tmpfs 380M 0 380M 0% /run/user/1000 Messages concerning ext4 filesystem in dmesg: [Fri Aug 9 23:04:32 2024] Kernel command line: coherent_pool=1M 8250.nr_uarts=0 snd_bcm2835.enable_headphones=0 snd_bcm2835.enable_headphones=1 snd_bcm2835.enable_hdmi=1 snd_bcm2835.enable_hdmi=0 smsc95xx.macaddr=D8:3A:DD:94:A9:B2 vc_mem.mem_base=0x3ec00000 vc_mem.mem_size=0x40000000 console=ttyS0,115200 console=tty1 root=PARTUUID=1006824c-02 rootfstype=ext4 fsck.repair=yes rootwait [Fri Aug 9 23:04:34 2024] EXT4-fs (mmcblk0p2): mounted filesystem 56f80fa2-e005-4cca-86e6-19da1069914d ro with ordered data mode. Quota mode: none. [Fri Aug 9 23:04:36 2024] EXT4-fs (mmcblk0p2): re-mounted 56f80fa2-e005-4cca-86e6-19da1069914d r/w. Quota mode: none. Show mounted filesystems: TARGET SOURCE FSTYPE OPTIONS / /dev/mmcblk0p2 ext4 rw,noatime,commit=600 |-/sys sysfs sysfs rw,nosuid,nodev,noexec,relatime | |-/sys/kernel/security securityfs securityfs rw,nosuid,nodev,noexec,relatime | |-/sys/fs/cgroup cgroup2 cgroup2 rw,nosuid,nodev,noexec,relatime,nsdelegate,memory_recursiveprot | |-/sys/fs/pstore pstore pstore rw,nosuid,nodev,noexec,relatime | |-/sys/fs/bpf bpf bpf rw,nosuid,nodev,noexec,relatime,mode=700 | |-/sys/kernel/debug debugfs debugfs rw,nosuid,nodev,noexec,relatime | |-/sys/kernel/tracing tracefs tracefs rw,nosuid,nodev,noexec,relatime | |-/sys/fs/fuse/connections fusectl fusectl rw,nosuid,nodev,noexec,relatime | `-/sys/kernel/config configfs configfs rw,nosuid,nodev,noexec,relatime |-/proc proc proc rw,relatime | `-/proc/sys/fs/binfmt_misc systemd-1 autofs rw,relatime,fd=30,pgrp=1,timeout=0,minproto=5,maxproto=5,direct,pipe_ino=4897 | `-/proc/sys/fs/binfmt_misc binfmt_misc binfmt_misc rw,nosuid,nodev,noexec,relatime |-/dev udev devtmpfs rw,nosuid,relatime,size=1671304k,nr_inodes=417826,mode=755 | |-/dev/pts devpts devpts rw,nosuid,noexec,relatime,gid=5,mode=620,ptmxmode=000 | |-/dev/shm tmpfs tmpfs rw,nosuid,nodev | `-/dev/mqueue mqueue mqueue rw,nosuid,nodev,noexec,relatime |-/run tmpfs tmpfs rw,nosuid,nodev,noexec,relatime,size=388308k,mode=755 | |-/run/lock tmpfs tmpfs rw,nosuid,nodev,noexec,relatime,size=5120k | |-/run/credentials/systemd-sysctl.service ramfs ramfs ro,nosuid,nodev,noexec,relatime,mode=700 | |-/run/credentials/systemd-sysusers.service ramfs ramfs ro,nosuid,nodev,noexec,relatime,mode=700 | |-/run/credentials/systemd-tmpfiles-setup-dev.service ramfs ramfs ro,nosuid,nodev,noexec,relatime,mode=700 | |-/run/rpc_pipefs sunrpc rpc_pipefs rw,relatime | |-/run/credentials/systemd-tmpfiles-setup.service ramfs ramfs ro,nosuid,nodev,noexec,relatime,mode=700 | `-/run/user/1000 tmpfs tmpfs rw,nosuid,nodev,relatime,size=388304k,nr_inodes=97076,mode=700,uid=1000,gid=1000 `-/boot/firmware /dev/mmcblk0p1 vfat rw,relatime,fmask=0022,dmask=0022,codepage=437,iocharset=ascii,shortname=mixed,errors=remount-ro Files in neuralgic directories: /var: 641M /var/ 207M /var/cache 201M /var/cache/apt 181M /var/lib 136M /var/lib/apt/lists Archived and active journals take up 52.0M in the file system. /opt/iobroker/backups: 3.3M /opt/iobroker/backups/ /opt/iobroker/iobroker-data: 819M /opt/iobroker/iobroker-data/ 771M /opt/iobroker/iobroker-data/files 441M /opt/iobroker/iobroker-data/files/javascript.admin 409M /opt/iobroker/iobroker-data/files/javascript.admin/static 408M /opt/iobroker/iobroker-data/files/javascript.admin/static/js The five largest files in iobroker-data are: 27M /opt/iobroker/iobroker-data/files/backitup.admin/static/js/main.ce422ec2.js.map 24M /opt/iobroker/iobroker-data/files/web.admin/static/js/main.135279a0.js.map 22M /opt/iobroker/iobroker-data/files/modbus.admin/static/js/main.18496c94.js.map 19M /opt/iobroker/iobroker-data/files/vis-2/static/js/main.e7bb655f.js.map 19M /opt/iobroker/iobroker-data/files/vis-2/static/js/main.368dc292.js.map USB-Devices by-id: USB-Sticks - Avoid direct links to /dev/tty* in your adapter setups, please always prefer the links 'by-id': /dev/serial/by-id/usb-Silicon_Labs_CP2102_USB_to_UART_Bridge_Controller_0039-if00-port0 /dev/serial/by-id/usb-ITead_Sonoff_Zigbee_3.0_USB_Dongle_Plus_28c71fb564d8ed1194276b6162c613ac-if00-port0 Your zigbee.0 COM-Port is matching 'by-id'. Very good! *** NodeJS-Installation *** /usr/bin/nodejs v20.16.0 /usr/bin/node v20.16.0 /usr/bin/npm 10.8.1 /usr/bin/npx 10.8.1 /usr/bin/corepack 0.28.2 nodejs: Installed: 20.16.0-1nodesource1 Candidate: 20.16.0-1nodesource1 Version table: *** 20.16.0-1nodesource1 1001 500 https://deb.nodesource.com/node_20.x nodistro/main arm64 Packages 100 /var/lib/dpkg/status 20.15.1-1nodesource1 1001 500 https://deb.nodesource.com/node_20.x nodistro/main arm64 Packages 20.15.0-1nodesource1 1001 500 https://deb.nodesource.com/node_20.x nodistro/main arm64 Packages 20.14.0-1nodesource1 1001 500 https://deb.nodesource.com/node_20.x nodistro/main arm64 Packages 20.13.1-1nodesource1 1001 500 https://deb.nodesource.com/node_20.x nodistro/main arm64 Packages 20.13.0-1nodesource1 1001 500 https://deb.nodesource.com/node_20.x nodistro/main arm64 Packages 20.12.2-1nodesource1 1001 500 https://deb.nodesource.com/node_20.x nodistro/main arm64 Packages 20.12.1-1nodesource1 1001 500 https://deb.nodesource.com/node_20.x nodistro/main arm64 Packages 20.12.0-1nodesource1 1001 500 https://deb.nodesource.com/node_20.x nodistro/main arm64 Packages 20.11.1-1nodesource1 1001 500 https://deb.nodesource.com/node_20.x nodistro/main arm64 Packages 20.11.0-1nodesource1 1001 500 https://deb.nodesource.com/node_20.x nodistro/main arm64 Packages 20.10.0-1nodesource1 1001 500 https://deb.nodesource.com/node_20.x nodistro/main arm64 Packages 20.9.0-1nodesource1 1001 500 https://deb.nodesource.com/node_20.x nodistro/main arm64 Packages 20.8.1-1nodesource1 1001 500 https://deb.nodesource.com/node_20.x nodistro/main arm64 Packages 20.8.0-1nodesource1 1001 500 https://deb.nodesource.com/node_20.x nodistro/main arm64 Packages 20.7.0-1nodesource1 1001 500 https://deb.nodesource.com/node_20.x nodistro/main arm64 Packages 20.6.1-1nodesource1 1001 500 https://deb.nodesource.com/node_20.x nodistro/main arm64 Packages 20.6.0-1nodesource1 1001 500 https://deb.nodesource.com/node_20.x nodistro/main arm64 Packages 20.5.1-1nodesource1 1001 500 https://deb.nodesource.com/node_20.x nodistro/main arm64 Packages 20.5.0-1nodesource1 1001 500 https://deb.nodesource.com/node_20.x nodistro/main arm64 Packages 20.4.0-1nodesource1 1001 500 https://deb.nodesource.com/node_20.x nodistro/main arm64 Packages 20.3.1-1nodesource1 1001 500 https://deb.nodesource.com/node_20.x nodistro/main arm64 Packages 20.3.0-1nodesource1 1001 500 https://deb.nodesource.com/node_20.x nodistro/main arm64 Packages 20.2.0-1nodesource1 1001 500 https://deb.nodesource.com/node_20.x nodistro/main arm64 Packages 20.1.0-1nodesource1 1001 500 https://deb.nodesource.com/node_20.x nodistro/main arm64 Packages 20.0.0-1nodesource1 1001 500 https://deb.nodesource.com/node_20.x nodistro/main arm64 Packages 18.19.0+dfsg-6~deb12u2 500 500 http://deb.debian.org/debian bookworm/main arm64 Packages 18.19.0+dfsg-6~deb12u1 500 500 http://deb.debian.org/debian-security bookworm-security/main arm64 Packages Temp directories causing npm8 problem: 0 No problems detected Errors in npm tree: *** ioBroker-Installation *** ioBroker Status iobroker is running on this host. Objects type: jsonl States type: jsonl Core adapters versions js-controller: 6.0.9 admin: 7.0.22 javascript: 8.7.6 nodejs modules from github: 0 Adapter State + system.adapter.admin.0 : admin : raspberrypi - enabled, port: 8081, bind: 0.0.0.0, run as: admin + system.adapter.backitup.0 : backitup : raspberrypi - enabled + system.adapter.discovery.0 : discovery : raspberrypi - enabled + system.adapter.energiefluss.0 : energiefluss : raspberrypi - enabled + system.adapter.influxdb.0 : influxdb : raspberrypi - enabled, port: 8086 + system.adapter.javascript.0 : javascript : raspberrypi - enabled + system.adapter.kecontact.0 : kecontact : raspberrypi - enabled + system.adapter.modbus.0 : modbus : raspberrypi - enabled + system.adapter.smartmeter.0 : smartmeter : raspberrypi - enabled + system.adapter.solarlog.0 : solarlog : raspberrypi - enabled, port: 80 + system.adapter.sonoff.0 : sonoff : raspberrypi - enabled, port: 1883, bind: 0.0.0.0 system.adapter.vis-2-widgets-energy.0 : vis-2-widgets-energy : raspberrypi - enabled system.adapter.vis-2-widgets-gauges.0 : vis-2-widgets-gauges : raspberrypi - enabled + system.adapter.vis-2.0 : vis-2 : raspberrypi - enabled system.adapter.vis-metro.0 : vis-metro : raspberrypi - enabled system.adapter.vis.0 : vis : raspberrypi - enabled + system.adapter.web.0 : web : raspberrypi - enabled, port: 8082, bind: 0.0.0.0, run as: admin + system.adapter.zigbee.0 : zigbee : raspberrypi - enabled, port: /dev/serial/by-id/usb-ITead_Sonoff_Zigbee_3.0_USB_Dongle_Plus_28c71fb564d8ed1194276b6162c613ac-if00-port0 + instance is alive Enabled adapters with bindings + system.adapter.admin.0 : admin : raspberrypi - enabled, port: 8081, bind: 0.0.0.0, run as: admin + system.adapter.influxdb.0 : influxdb : raspberrypi - enabled, port: 8086 + system.adapter.solarlog.0 : solarlog : raspberrypi - enabled, port: 80 + system.adapter.sonoff.0 : sonoff : raspberrypi - enabled, port: 1883, bind: 0.0.0.0 + system.adapter.web.0 : web : raspberrypi - enabled, port: 8082, bind: 0.0.0.0, run as: admin + system.adapter.zigbee.0 : zigbee : raspberrypi - enabled, port: /dev/serial/by-id/usb-ITead_Sonoff_Zigbee_3.0_USB_Dongle_Plus_28c71fb564d8ed1194276b6162c613ac-if00-port0 ioBroker-Repositories ┌─────────┬──────────┬─────────────────────────────────────────────────────────┬──────────────┐ │ (index) │ name │ url │ auto upgrade │ ├─────────┼──────────┼─────────────────────────────────────────────────────────┼──────────────┤ │ 0 │ 'stable' │ 'http://download.iobroker.net/sources-dist.json' │ false │ │ 1 │ 'beta' │ 'http://download.iobroker.net/sources-dist-latest.json' │ false │ └─────────┴──────────┴─────────────────────────────────────────────────────────┴──────────────┘ Active repo(s): stable Upgrade policy: none Installed ioBroker-Instances Used repository: stable Adapter "admin" : 7.0.22 , installed 7.0.22 Adapter "backitup" : 3.0.16 , installed 3.0.16 Adapter "discovery" : 4.5.0 , installed 4.5.0 Adapter "energiefluss" : 3.6.0 , installed 3.6.0 Adapter "influxdb" : 4.0.2 , installed 4.0.2 Adapter "javascript" : 8.7.6 , installed 8.7.6 Controller "js-controller": 6.0.9 , installed 6.0.9 Adapter "kecontact" : 2.2.0 , installed 2.2.0 Adapter "modbus" : 6.2.3 , installed 6.2.3 Adapter "simple-api" : 2.8.0 , installed 2.8.0 Adapter "smartmeter" : 3.4.0 , installed 3.4.0 Adapter "socketio" : 6.7.1 , installed 6.7.1 Adapter "solarlog" : 2.3.0 , installed 2.3.0 Adapter "sonoff" : 3.1.0 , installed 3.1.0 Adapter "vis" : 1.5.6 , installed 1.5.6 Adapter "vis-2" : 2.9.32 , installed 2.9.32 Adapter "vis-2-widgets-energy": 0.3.11, installed 0.3.11 Adapter "vis-2-widgets-gauges": 1.0.3, installed 1.0.3 Adapter "vis-metro" : 1.2.0 , installed 1.2.0 Adapter "web" : 6.2.5 , installed 6.2.5 Adapter "ws" : 2.6.2 , installed 2.6.2 Adapter "zigbee" : 1.10.3 , installed 1.10.3 Objects and States Please stand by - This may take a while Objects: 692 States: 518 *** OS-Repositories and Updates *** Hit:1 https://repos.influxdata.com/debian stable InRelease Hit:2 http://deb.debian.org/debian bookworm InRelease Hit:3 http://archive.raspberrypi.com/debian bookworm InRelease Hit:4 http://deb.debian.org/debian-security bookworm-security InRelease Hit:5 https://apt.grafana.com stable InRelease Hit:6 https://deb.nodesource.com/node_20.x nodistro InRelease Hit:7 http://deb.debian.org/debian bookworm-updates InRelease Reading package lists... Pending Updates: 0 *** Listening Ports *** Active Internet connections (only servers) Proto Recv-Q Send-Q Local Address Foreign Address State User Inode PID/Program name tcp 0 0 127.0.0.1:9000 0.0.0.0:* LISTEN 1001 35733 6246/iobroker.js-co tcp 0 0 127.0.0.1:9001 0.0.0.0:* LISTEN 1001 35728 6246/iobroker.js-co tcp 0 0 0.0.0.0:22 0.0.0.0:* LISTEN 0 5677 709/sshd: /usr/sbin tcp 0 0 0.0.0.0:1883 0.0.0.0:* LISTEN 1001 67450 14676/io.sonoff.0 tcp6 0 0 :::3000 :::* LISTEN 106 43382 12678/grafana tcp6 0 0 :::22 :::* LISTEN 0 5679 709/sshd: /usr/sbin tcp6 0 0 :::8081 :::* LISTEN 1001 35790 6264/io.admin.0 tcp6 0 0 :::8082 :::* LISTEN 1001 39045 6441/io.web.0 tcp6 0 0 :::8086 :::* LISTEN 999 36166 6053/influxd udp 0 0 0.0.0.0:33078 0.0.0.0:* 104 6254 490/avahi-daemon: r udp 0 0 0.0.0.0:41605 0.0.0.0:* 1001 62444 13897/io.kecontact. udp 0 0 0.0.0.0:7090 0.0.0.0:* 1001 62442 13897/io.kecontact. udp 0 0 0.0.0.0:7092 0.0.0.0:* 1001 62443 13897/io.kecontact. udp 0 0 0.0.0.0:5353 0.0.0.0:* 104 6252 490/avahi-daemon: r udp6 0 0 :::49087 :::* 104 6255 490/avahi-daemon: r udp6 0 0 fe80::7613:9172:fa9:546 :::* 0 673 644/NetworkManager udp6 0 0 :::5353 :::* 104 6253 490/avahi-daemon: r *** Log File - Last 25 Lines *** 2024-08-11 20:39:32.441 - info: smartmeter.0 (6395) Received 10 values, 1 updated 2024-08-11 20:39:50.152 - info: smartmeter.0 (6395) Received 10 values, 1 updated 2024-08-11 20:39:59.136 - info: kecontact.0 (13897) (re)start charging with 6000mA 2024-08-11 20:40:09.602 - info: smartmeter.0 (6395) Received 10 values, 3 updated 2024-08-11 20:40:27.306 - info: smartmeter.0 (6395) Received 10 values, 1 updated 2024-08-11 20:40:29.101 - info: kecontact.0 (13897) (re)start charging with 6000mA 2024-08-11 20:40:45.017 - info: smartmeter.0 (6395) Received 10 values, 1 updated 2024-08-11 20:40:59.097 - info: kecontact.0 (13897) (re)start charging with 6000mA 2024-08-11 20:41:02.444 - info: smartmeter.0 (6395) Received 10 values, 3 updated 2024-08-11 20:41:20.140 - info: smartmeter.0 (6395) Received 10 values, 1 updated 2024-08-11 20:41:29.097 - info: kecontact.0 (13897) (re)start charging with 6000mA 2024-08-11 20:41:37.880 - info: smartmeter.0 (6395) Received 10 values, 3 updated 2024-08-11 20:41:55.578 - info: smartmeter.0 (6395) Received 10 values, 1 updated 2024-08-11 20:41:59.096 - info: kecontact.0 (13897) (re)start charging with 6000mA 2024-08-11 20:42:13.300 - info: smartmeter.0 (6395) Received 10 values, 1 updated 2024-08-11 20:42:29.098 - info: kecontact.0 (13897) (re)start charging with 6000mA 2024-08-11 20:42:29.605 - info: smartmeter.0 (6395) Received 10 values, 3 updated 2024-08-11 20:42:47.882 - info: smartmeter.0 (6395) Received 10 values, 5 updated 2024-08-11 20:42:59.099 - info: kecontact.0 (13897) (re)start charging with 6000mA 2024-08-11 20:43:05.567 - info: smartmeter.0 (6395) Received 10 values, 3 updated 2024-08-11 20:43:23.282 - info: smartmeter.0 (6395) Received 10 values, 1 updated 2024-08-11 20:43:29.097 - info: kecontact.0 (13897) (re)start charging with 6000mA 2024-08-11 20:43:41.010 - info: smartmeter.0 (6395) Received 10 values, 3 updated 2024-08-11 20:43:58.815 - info: smartmeter.0 (6395) Received 10 values, 1 updated 2024-08-11 20:43:59.190 - info: kecontact.0 (13897) (re)start charging with 6000mA ============ Mark until here for C&P ============= iob diag has finished.======================= SUMMARY ======================= v.2024-05-22 Static hostname: raspberrypi Icon name: computer Operating System: Debian GNU/Linux 12 (bookworm) Kernel: Linux 6.6.31+rpt-rpi-v8 Architecture: arm64 Installation: native Kernel: aarch64 Userland: 64 bit Timezone: Europe/Berlin (CEST, +0200) User-ID: 1000 Display-Server: false Boot Target: multi-user.target Pending OS-Updates: 0 Pending iob updates: 0 Nodejs-Installation: /usr/bin/nodejs v20.16.0 /usr/bin/node v20.16.0 /usr/bin/npm 10.8.1 /usr/bin/npx 10.8.1 /usr/bin/corepack 0.28.2 Recommended versions are nodejs 20.16.0 and npm 10.8.1 Your nodejs installation is correct MEMORY: total used free shared buff/cache available Mem: 4.0G 1.7G 367M 1.2M 2.0G 2.3G Swap: 209M 0B 209M Total: 4.2G 1.7G 577M Active iob-Instances: 15 Upgrade policy: none ioBroker Core: js-controller 6.0.9 admin 7.0.22 ioBroker Status: iobroker is running on this host. Objects type: jsonl States type: jsonl Status admin and web instance: + system.adapter.admin.0 : admin : raspberrypi - enabled, port: 8081, bind: 0.0.0.0, run as: admin + system.adapter.web.0 : web : raspberrypi - enabled, port: 8082, bind: 0.0.0.0, run as: admin Objects: 692 States: 518 Size of iob-Database: 16M /opt/iobroker/iobroker-data/objects.jsonl 2.4M /opt/iobroker/iobroker-data/states.jsonl =================== END OF SUMMARY ======================= Mark text until here for copying ===
-
@stefan-falt sieht erstmal so nicht schlecht aus. Wieviele Datenpunkte speicherst du in InfluxDB? oder InfluxDB2?
2024-08-11 20:41:20.140  - info: smartmeter.0 (6395) Received 10 values, 1 updated
2024-08-11 20:41:29.097  - info: kecontact.0 (13897) (re)start charging with 6000mA
2024-08-11 20:41:37.880  - info: smartmeter.0 (6395) Received 10 values, 3 updated
2024-08-11 20:41:55.578  - info: smartmeter.0 (6395) Received 10 values, 1 updated
2024-08-11 20:41:59.096  - info: kecontact.0 (13897) (re)start charging with 6000mA
2024-08-11 20:42:13.300  - info: smartmeter.0 (6395) Received 10 values, 1 updated
2024-08-11 20:42:29.098  - info: kecontact.0 (13897) (re)start charging with 6000mA
2024-08-11 20:42:29.605  - info: smartmeter.0 (6395) Received 10 values, 3 updated
2024-08-11 20:42:47.882  - info: smartmeter.0 (6395) Received 10 values, 5 updated
2024-08-11 20:42:59.099  - info: kecontact.0 (13897) (re)start charging with 6000mA
2024-08-11 20:43:05.567  - info: smartmeter.0 (6395) Received 10 values, 3 updated
2024-08-11 20:43:23.282  - info: smartmeter.0 (6395) Received 10 values, 1 updated
2024-08-11 20:43:29.097  - info: kecontact.0 (13897) (re)start charging with 6000mA
2024-08-11 20:43:41.010  - info: smartmeter.0 (6395) Received 10 values, 3 updated
2024-08-11 20:43:58.815  - info: smartmeter.0 (6395) Received 10 values, 1 updated
2024-08-11 20:43:59.190  - info: kecontact.0 (13897) (re)start charging with 6000mA
Bin mir hier nicht ganz sicher wie ich das interpretieren soll. Ich bin fast der Meinung, dass hier zu oft, zu viele Daten verarbeitet werden müssen. Werden diese Daten in der InfluxDB erfasst?
Ro75.
-
@ro75
JA, der "kecontact" ist die Keba Wallbox und "smartmeter" der hichi IR Reader am Stromzähler. Beide sind immer recht gesprächig - aber das ist ja nur alle paar Sekunden.Sollte das zuviel sein? Ich bin kein Profi - aber das sehe ich nicht.
Datenpunkte habe ich ca. 10 Stück. Alle Temperatur Sensoren, Strom ins Netz vom Netz und zwei Steckdosen.
kopfkratz Ich weis nicht was ich noch tun muss. Als nächstes würde ich alles neu auf eine SSD installieren.
-
@stefan-falt ist jetzt von mir keine exakte Wissenschaft, aber beim PI gibt es doch die grüne LED. Wie oft blinkt oder leuchtet sogar länger?
Ro75.
-
@ro75
Dioe grüne LED blinkt unregelmäßig 0 bis 10 mal pro Sekunde. -
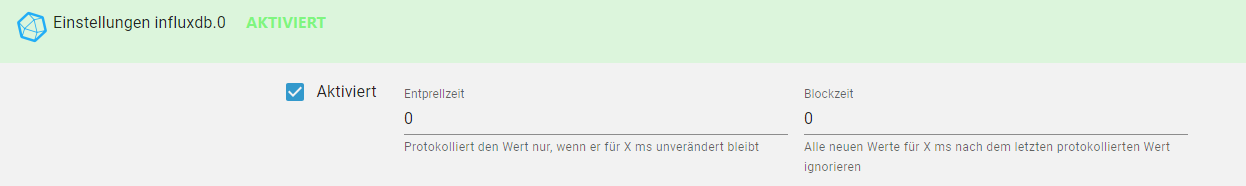
Hast du bei den DP schon mal mit der Blockzeit gearbeitet? Für mich würde es reichen, wenn ich aller 10 Sekunden Daten zur Auswertung erfassen würde und nicht wenn der Adapter mir sekündlich oder vielleicht noch öfters Daten bringt. Für nen PI mit SD-Karte kann das schon zuviel werden.
Stelle doch mal bei Blockzeit was zwischen 5000 und 10000 ein. Beobachte das ganze dann mal.
Eine SSD tat meinem PI damals auch mehr als gut. Damit flutschte alles besser.
Ro75.
-
@ro75
Hallo,
unverändert. Eine SSD ist bestellt, ich versuchs mal zwischenzeitlich mit einer alten 2,5" Festplatte")
Ich werde sehen was passiert ....Danke + MfG
Wolfgang -
@stefan-falt
Hast du schon mal probiert die query direkt auf der influx ui auszuführen?
Da könnte man die Fehlerursachen mehr eingrenzen.
Auch ein Blick in das influxlog könnte helfen.
Das der request in ein timeout läuft kann mehrere Ursachen haben- query läuft zu lange
- query bricht wegen Serverfehler ab
- ?
Das sieht man dieser Fehlermeldung nicht an
So wie es aussieht sucht ihr hier immer den Fehler im iobroker. Influx ist aber ein zusätzliches System das ja auch separat installiert wird. Iobroker bzw der Adapter ist nur ein Client für den DB server
-
@oliverio Hallo, danke für das Mitdenken.
influx ui
Werde ich tun, wenn die nächste Probleme auftreten.Ich habe jetzt eine 2,5" Festplatte angeschlossen, da die bestellte SSD erst am Samstag kommt und ioBroker neu aufgesetzt. Das geht übrigens überraschend gut.
Damit hatte ich allerdings aber auch diese "Query timeout" probleme. Jetzt habe ich den Query Timeout von 30000ms auf 60000ms gestellt, noch geht alles gut.
Ich werde weiter berichten.
MfG
StefanFalt -
@stefan-falt
Hallo, auch mit der neuen Installation auf der 2,5" HDD habe ich den gleichen Fehler. Das ist echt Seltsam.
Ein Typischer Fehler ist:influxdb.0 2024-08-13 21:49:26.683 warn Error in query "from(bucket: "iobroker") |> range(start: 2024-08-12T19:49:00.000Z, stop: 2024-08-13T19:49:00.000Z) |> filter(fn: (r) => r["_measurement"] == "modbus.0.inputRegisters.100.842_Battery_Power_(System)") |> pivot(rowKey:["_time"], columnKey: ["_field"], valueColumn: "_value") |> sort(columns:["_time"], desc: false)": RequestTimedOutError: Request timed outWenn ich die DB Abfrage in den Data Explorer kopiere, macht die DB genau das gleiche. Der Fehler ist also Systematiisch.
Wenn ich die Daten der letzten 3 Stunden anschauen will, klappt es manchmal. Es sieht so aus, als ob die DB unendlich langsam wäre.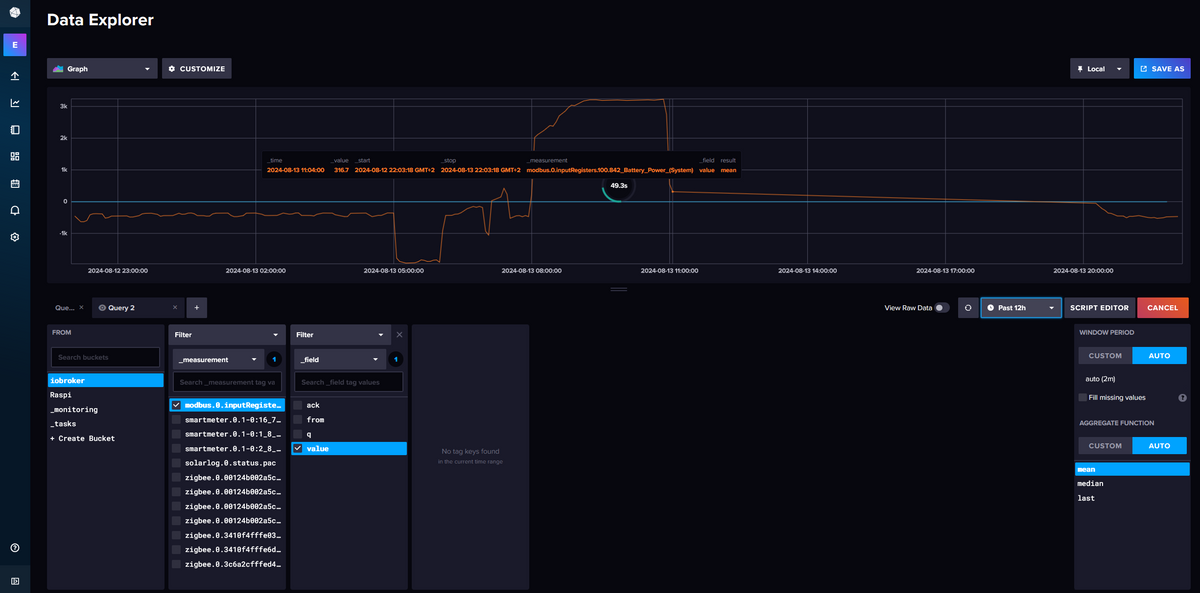
Ich werde das ganze mal auf SSD installieren und dann weiterschauen ....
Gibt es noch andere beschreibungen die DB zu installieren als die von Eddy? Vielleicht ist ja in der Beschreibung ein Fehler ....https://www.youtube.com/watch?v=abV4YRHXb5I&t=1040s -
@stefan-falt welche Version von influxdb läuft? Aktuell ist 2.7.9. Bei einer Vorversion gab es ein Problem 2.7.x Falls die 2.7.6 laufen sollte, könnte das
https://github.com/influxdata/influxdb/issues/25157
die Ursache sein.
Ro75
closed "context canceled" error after 2.7.6 to 2.7.7 upgrade #25157
-
Im Zweifel immer die Beschreibung des Herstellers
https://docs.influxdata.com/influxdb/v2/install/?t=LinuxKannst du die query evtl neu aufbauen?
Bin mit influx query nicht firm, aber auch mit sql kann mann query’s bauen die im nirwana landen. Wenn ich da sehe „pivot“ dann ist das schon aufwändig, da ja die Anzahl der Spalten erst ermittelt werden müssen.Ich sehe auch das du als rowkey time verwendest, das erzeugt je nach datenumfang auch ne Menge rows. Versuche mal testweise die auf eine Zeitscheibe zu aggregieren, also bspw 5 Minuten. Von da kannst dich dann steigern und schauen wo die Datenbank aussteigt, falls es ein performance/speicherproblem sein sollte.
-
@ro75 said in Datenbankfehler - egal wie oft ich neu installiere:
@stefan-falt welche Version von influxdb läuft? Aktuell ist 2.7.9. Bei einer Vorversion gab es ein Problem 2.7.x Falls die 2.7.6 laufen sollte, könnte das
https://github.com/influxdata/influxdb/issues/25157
die Ursache sein.
Ro75Hallo,
Inzwischen habe ich die Installation auf der 2,5" HDD wieder verworfen und bin wieder auf den MicroSD Speicherchip gagangen.
-> gleiche Fehler.ioBroker@raspberrypi:~ $ influx version Influx CLI dev (git: a79a2a1b825867421d320428538f76a4c90aa34c) build_date: 2024-04-16T14:34:26ZioBroker@raspberrypi:~ $ curl -sL -I localhost:8086/ping HTTP/1.1 204 No Content Vary: Accept-Encoding X-Influxdb-Build: OSS X-Influxdb-Version: v2.7.9 Date: Wed, 14 Aug 2024 19:14:49 GMT... und die Fehler sind unverändert:
influxdb.0
	2024-08-14 21:11:07.235	warn	Error in query "from(bucket: "iobroker") |> range(start: 2024-07-31T19:11:00.000Z, stop: 2024-08-14T19:11:00.000Z) |> filter(fn: (r) => r["_measurement"] == "modbus.0.inputRegisters.100.842_Battery_Power_(System)") |> pivot(rowKey:["_time"], columnKey: ["_field"], valueColumn: "_value") |> sort(columns:["_time"], desc: false)": RequestTimedOutError: Request timed out
Kann es sein, dass die Datenbank es nicht mag wenn in Zeiträumen gesucht wird, in denen keine Daten vorhanden sind? Kann ich mir aber nicht vorstellen, dann muss ja das Ergebnis "null" sein. (so war es zumindestens in einem früheren Leben auf der Oracle 10g Datenbank)
Bald kommt der 40€ 500GB SSD Stick ... Oo
-
@stefan-falt oder einfach viel zu viele Datensätze für den Rechner. Kannst du in Erfahrung bringen, wie viele wes sind?
Ro75.
-
Du zeigst immer nur das Iobroker log.
Was sagt das influx log?
https://docs.influxdata.com/influxdb/v2/admin/logs/Hast du den mal die Daten aggregiert? Das ist das ähnliche was @Ro75 auch meinte.
Wenn du es schon mit 2 Speichermedien probiert hast, wird ein 3. wahrscheinlich kein anderes Ergebnis bringen.
-
@stefan-falt sagte in [Datenbankfehler - egal wie oft ich neu
Kann es sein, dass die Datenbank es nicht mag wenn in Zeiträumen gesucht wird, in denen keine Daten vorhanden sind? Kann ich mir aber nicht vorstellen, dann muss ja das Ergebnis "null" sein. (so war es zumindestens in einem früheren Leben auf der Oracle 10g Datenbank)
Bald kommt der 40€ 500GB SSD Stick ... Oo
Zumindest das kann ich Dir bestätigen. Als ich noch FLOT zur Visualisierung benutzt habe, bin ich auf Geräten mit Touchscreen oder Touchpad beim Versuch, einen anderen Zeitraum einzustellen, auch schon in Bereiche gerutscht, für die es (noch) keine Daten gab. Da kam in iobroker dann auch eine ähnliche Fehlermeldung. Habe ich leider nicht mehr genau im Kopf, aber irgendwas mit range war dabei.
Gruss, Jürgen
-
@oliverio said in Datenbankfehler - egal wie oft ich neu installiere:
Du zeigst immer nur das Iobroker log.
Was sagt das influx log?
https://docs.influxdata.com/influxdb/v2/admin/logs/Hast du den mal die Daten aggregiert? Das ist das ähnliche was @Ro75 auch meinte.
Wenn du es schon mit 2 Speichermedien probiert hast, wird ein 3. wahrscheinlich kein anderes Ergebnis bringen.
Hallo Olliver,
danke für deine Zeit.Das Verzeichnis /var/log/influxdb/ war leer, darum habe ich das logging eingeschaltet:
root@raspberrypi:/# influxd 1>/var/log/influxdb/influxd.log
WARN[0000]log.go:228 gosnowflake.(*defaultLogger).Warn DBUS_SESSION_BUS_ADDRESS envvar looks to be not set, this can lead to runaway dbus-daemon processes. To avoid this, set envvar DBUS_SESSION_BUS_ADDRESS=$XDG_RUNTIME_DIR/bus (if it exists) or DBUS_SESSION_BUS_ADDRESS=/dev/null.
Error: listen tcp :8086: bind: address already in use
See 'influxd -h' for help
root@raspberrypi:/# DBUS_SESSION_BUS_ADDRESS=/dev/null
root@raspberrypi:/#
Dann wollte ich Daten der letzten 24 Stunden Ansehen, dass wurde aber mit dem bekannten Timeout Quittiert.
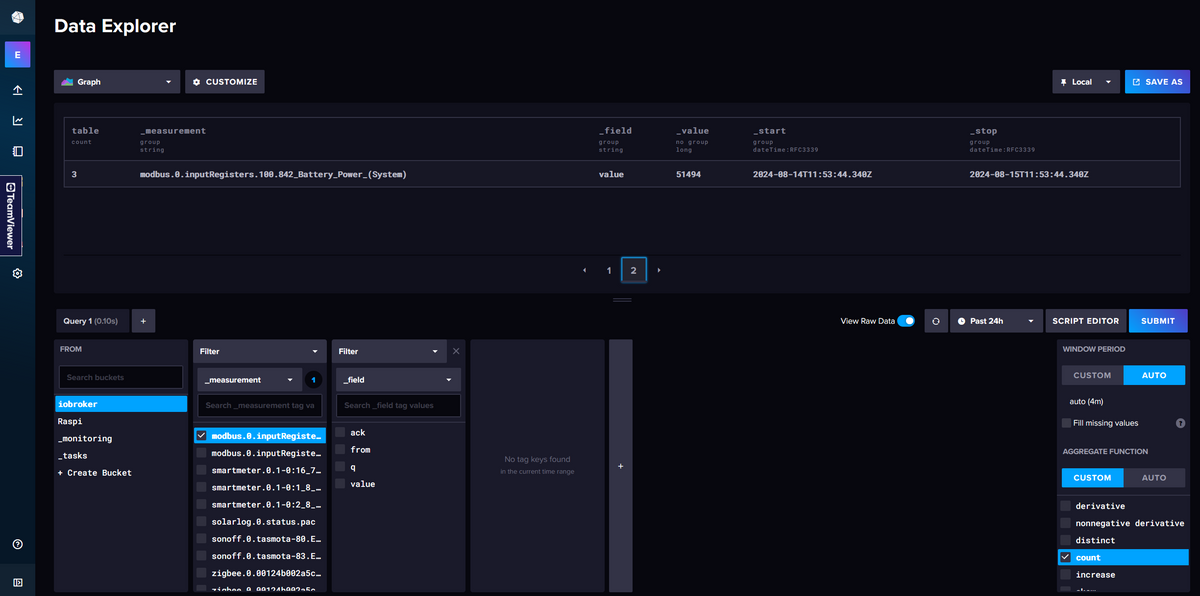
influxdb.0
	2024-08-15 13:44:18.806	warn	Error in query "from(bucket: "iobroker") |> range(start: 2024-08-14T11:44:00.000Z, stop: 2024-08-15T11:44:00.000Z) |> filter(fn: (r) => r["_measurement"] == "modbus.0.inputRegisters.100.842_Battery_Power_(System)") |> pivot(rowKey:["_time"], columnKey: ["_field"], valueColumn: "_value") |> sort(columns:["_time"], desc: false)": RequestTimedOutError: Request timed out
Jetzt habe ich mal einen count gemacht und siehe da, ca. 51000 die letzten 24 Stunden. Oder? Da bin ich mich nicht ganz sicher ...
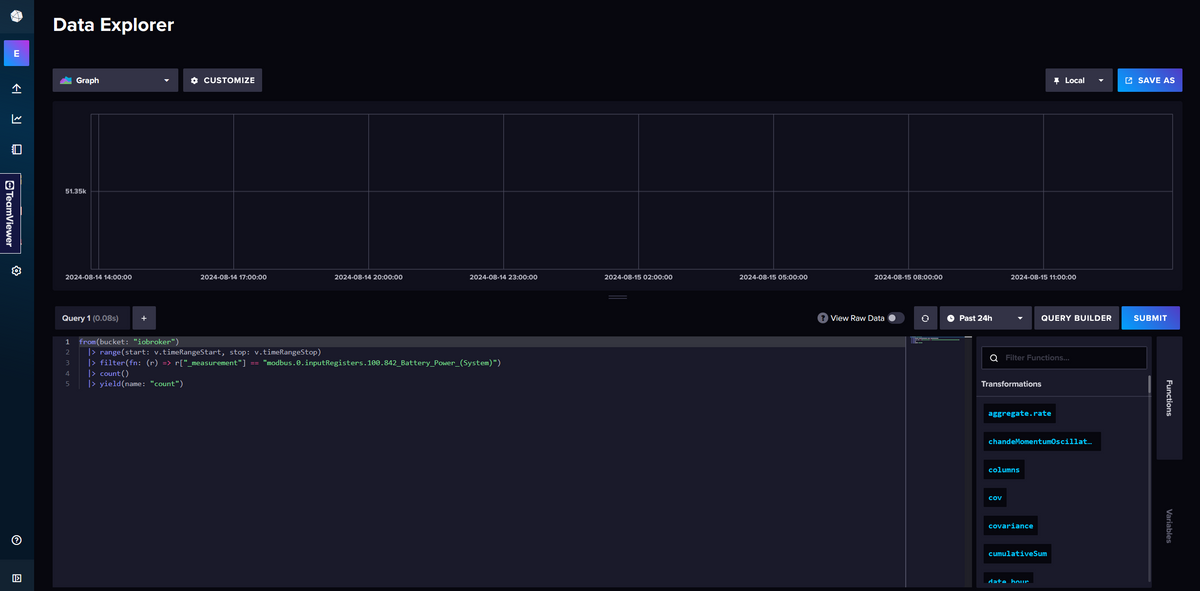
Ich würde jetzt den DB Inhalt löschen, und dann das Aufzeichnen neu starten, mit weniger Daten ...
Was muss ich denn da auswählen, damit nicht mehr so viele Daten anfallen, die Daten aber noch konsistent bleiben? Blockzeit auf 5000ms ???

Stichwort Log:
Das Log ist nach etwas rumspielen leer: "cat /var/log/influxdb/influxd.log"
Aber ich Denke wir haben das Problem gefunden -> Zu viele Datensätze. Oder?Danke + MfG
Wolfgang -
@stefan-falt stelle die Blockzeit mal auf 5000. Dann werden immer noch genügend Daten geloggt. Aber, das hat keine Auswirkung auf die bisher gesammelte Datenflut und damit auf den Effekt. Das wirst du also erst nach Tagen, respektive auf deinen Zeitraum feststellen können. Also Geduld.
Ro75.

