Navigation

    Logo
    • Register
    • Login
    • Search
    • Recent
    • Tags
    • Unread
    • Categories
    • Unreplied
    • Popular
    • GitHub
    • Docu
    • Hilfe
    1. Home
    2. Deutsch
    3. ioBroker Allgemein
    4. ECharts und json Daten

    NEWS

    • ioBroker goes Matter ... Matter Adapter in Stable

    • 15. 05. Wartungsarbeiten am ioBroker Forum

    • Monatsrückblick - April 2025

    ECharts und json Daten

    This topic has been deleted. Only users with topic management privileges can see it.
    • S
      Stefan_NK last edited by

      Hallo, liebe Community,

      ich komme leider mit einer geplanten Umsetzung nicht weiter und hoffe, ihr könnt mir helfen.

      Ich bekomme aus einem Fremdsystem (hat nichts mit Hausautomatisierung zu tun) ein JSON, das ich gerne in einen Datenpunkt kopieren und die Inhalte grafisch darstellen möchte. Es handelt sich dabei um ein Datum oder num. Wert auf der X-Achseeinen und einen numerischen Wert auf der y-Achse. Es sind immer max. 30 Einträge möglich.

      Als Test-json habe ich mal erstellt:

      {
        "Test": [
          {
            "ts": "1726308000",
            "value": "35"
          },
          {
            "ts": "1726311600",
            "value": "21"
          },
          {
            "ts": "1726315200",
            "value": "45"
          }
        ]
      }
      

      In den EChars habe ich dann ein Preset mit dem Datenpunkt als Quelle angelegt, bekomme aber nichts angezeigt.
      Woran kann das liegen? Muss ich noch irgendwas beim JSON berücksichtigen?

      LG Stefan

      S 1 Reply Last reply Reply Quote 0
      • S
        Sombornus @Stefan_NK last edited by

        Hallo @stefan_nk, probiere mal Dein json Beispiel so anzupassen:
        [
        {
        "ts": "1726308000",
        "value": "35"
        },
        {
        "ts": "1726311600",
        "value": "21"
        },
        {
        "ts": "1726315200",
        "value": "45"
        }
        ]
        Sieht dann bei mir so aus:
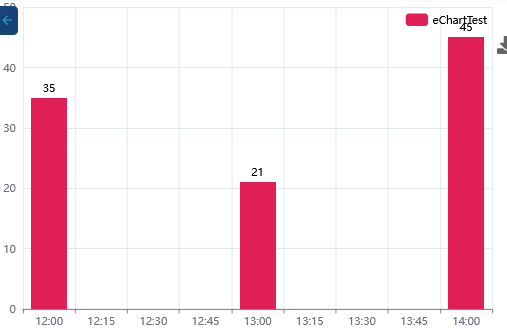
        b152ffbe-7c86-4f23-9154-6c2d351940f4-grafik.png
        Viel Erfolg

        S 1 Reply Last reply Reply Quote 0
        • S
          Stefan_NK @Sombornus last edited by

          @sombornus Danke, da habe ich das JSON doch glatt falsch aufgebaut 👶

          Leider bringt das Chart für mich nicht den gewünschten Erfolg, weil der Aufbau in der VIS bis zur vollen Darstellung 12 Sekunden dauert. 😞

          1 Reply Last reply Reply Quote 0
          • First post
            Last post

          Support us

          ioBroker
          Community Adapters
          Donate
          FAQ Cloud / IOT
          HowTo: Node.js-Update
          HowTo: Backup/Restore
          Downloads
          BLOG

          264
          Online

          31.6k
          Users

          79.5k
          Topics

          1.3m
          Posts

          2
          3
          306
          Loading More Posts
          • Oldest to Newest
          • Newest to Oldest
          • Most Votes
          Reply
          • Reply as topic
          Log in to reply
          Community
          Impressum | Datenschutz-Bestimmungen | Nutzungsbedingungen
          The ioBroker Community 2014-2023
          logo