Jarvis 3.1.8 - zukünftige Strompreise - Skalierung, Farben
-
Hallo,
ich habe heute tibberHTML wie in der Anleitung https://mcuiobroker.gitbook.io/jarvis-infos/jarvis-v3/tibber/tibberhtml-pro beschrieben eingestellt
Leider bleiben sowohl today als auch tomorrow leer.
Hier der DP htmltoday:<!DOCTYPE html><html lang="en"><head><meta charset="UTF-8"><meta name="viewport" content="width=device-width, initial-scale=1.0"><title>Tibber-Tageswert</title><script src="https://cdn.jsdelivr.net/npm/echarts@5.4.3/dist/echarts.min.js"></script><script src="https://cdnjs.cloudflare.com/ajax/libs/moment.js/2.29.1/moment.min.js"></script></head><body><div id="chart-container" style="width: 100%; height:400px;"></div><script> var data = [{"time":1738537200000,"value":0.398,"tax":0.2685,"energy":0.1295,"level":"NORMAL"},{"time":1738540800000,"value":0.3945,"tax":0.2679,"energy":0.1266,"level":"NORMAL"},{"time":1738544400000,"value":0.3922,"tax":0.2675,"energy":0.1247,"level":"NORMAL"},{"time":1738548000000,"value":0.3867,"tax":0.2667,"energy":0.12,"level":"NORMAL"},{"time":1738551600000,"value":0.3905,"tax":0.2673,"energy":0.1232,"level":"NORMAL"},{"time":1738555200000,"value":0.3959,"tax":0.2681,"energy":0.1278,"level":"NORMAL"},{"time":1738558800000,"value":0.4332,"tax":0.274,"energy":0.1592,"level":"NORMAL"},{"time":1738562400000,"value":0.4912,"tax":0.2833,"energy":0.2079,"level":"EXPENSIVE"},{"time":1738566000000,"value":0.5333,"tax":0.2901,"energy":0.2432,"level":"EXPENSIVE"},{"time":1738569600000,"value":0.4557,"tax":0.2777,"energy":0.178,"level":"NORMAL"},{"time":1738573200000,"value":0.4222,"tax":0.2722,"energy":0.15,"level":"NORMAL"},{"time":1738576800000,"value":0.3938,"tax":0.2678,"energy":0.126,"level":"NORMAL"},{"time":1738580400000,"value":0.3834,"tax":0.2661,"energy":0.1173,"level":"NORMAL"},{"time":1738584000000,"value":0.381,"tax":0.2657,"energy":0.1153,"level":"NORMAL"},{"time":1738587600000,"value":0.3916,"tax":0.2674,"energy":0.1242,"level":"NORMAL"},{"time":1738591200000,"value":0.4174,"tax":0.2715,"energy":0.1459,"level":"NORMAL"},{"time":1738594800000,"value":0.447,"tax":0.2763,"energy":0.1707,"level":"NORMAL"},{"time":1738598400000,"value":0.5008,"tax":0.2848,"energy":0.216,"level":"EXPENSIVE"},{"time":1738602000000,"value":0.4827,"tax":0.282,"energy":0.2007,"level":"EXPENSIVE"},{"time":1738605600000,"value":0.4831,"tax":0.282,"energy":0.2011,"level":"EXPENSIVE"},{"time":1738609200000,"value":0.4434,"tax":0.2757,"energy":0.1677,"level":"NORMAL"},{"time":1738612800000,"value":0.4259,"tax":0.2729,"energy":0.153,"level":"NORMAL"},{"time":1738616400000,"value":0.4154,"tax":0.2712,"energy":0.1442,"level":"NORMAL"},{"time":1738620000000,"value":0.4054,"tax":0.2696,"energy":0.1358,"level":"NORMAL"}]; var chartContainer = document.getElementById("chart-container"); var myChart = echarts.init(chartContainer); function formatTime(time) { return moment(time).format("HH"); } function calculateArrowPosition(hour){ return (hour / 24) * 100 +1 + "%"; } function updateChart() { var minValue = Math.min.apply(null, data.map(function (item) { return item.value; })); var yAxisMin = 0.36; var maxValue = 0.533; let avgValue = 0.428; var visualMapPieces =[{"gt":0,"lte":0.15,"color":"lightgreen"},{"gt":0.15,"lte":0.22,"color":"green"},{"gt":0.22,"lte":0.29,"color":"yellow"},{"gt":0.29,"lte":0.35,"color":"orange"},{"gt":0.35,"color":"red"}]; var values = data.map(item => (item.value-minValue).toFixed(2)); var maxLineValue = Math.max.apply(null, values); var maxLineIndex = values.indexOf(maxLineValue); var maxLineData = {time:1738566000000,value:0.533}; var currentHour = new Date().getHours() ; var currentDay = new Date().getDate(); var endOfDayTimestamp = 1738623599999; var colorStops = []; visualMapPieces.map(piece => { if(piece["lte"] >=yAxisMin && piece["gt"]<=maxValue){ if(piece["gt"]>=yAxisMin){ colorStops.push({ offset: ((piece["gt"]-yAxisMin)/(maxValue-yAxisMin)), color: piece.color }); } if(piece["lte"]<=maxValue){ colorStops.push({ offset: ((piece["lte"]-yAxisMin)/(maxValue-yAxisMin)), color: piece.color }); } if(piece["lte"]>maxValue ){ colorStops.push({ offset: 1, color: piece.color }); }; }else{ if(piece["lte"]>=maxValue && piece["gt"]<=maxValue ){ colorStops.push({ offset: ((piece["lte"]-yAxisMin)/(maxValue-yAxisMin)), color: piece.color }); }else if(piece["lte"]>=maxValue && piece["gt"] <= maxValue){ colorStops.push({ offset: ((piece["lte"]-yAxisMin)/(maxValue-yAxisMin)), color: piece.color }); } }; }); colorStops.push({ offset: 1, color: colorStops[colorStops.length-1].color }); colorStops.splice(0, 0, {offset: 0,color:colorStops[0].color}); myChart.setOption({ title: { text: "Today-Tageswerte", show: true }, visualMap: { type: "piecewise", pieces: visualMapPieces, dimension: 1, showLabel: true, precision: 2, itemWidth: 6, orient: "horizontal", left: "center", calculable: true,selectedMode: "multiple", bottom: 10, text: ["High", "Low"], textStyle: { color: "white" }, }, grid: { right: 50, left: 10, containLabel: true }, areaStyle: { color: colorStops }, toolbox: { feature: { saveAsImage: { backgroundColor: "rgba(38, 37, 37, 1)", title: "Speichern", name: "TibberHTML Today 03.02.2025" }, magicType: { type: ["line", "bar"], title:{ line: "Line-Chart", bar: "Bar-Chart", } }, dataView: { title: "Daten aus der Serie", lang: ["Daten der Kurve", "Schließen", "Aktualisieren"], optionToContent: function (opt) { var table = '<table style="width:100%;"><tbody><tr style="text-align: left;"><th>Stunde</th><th>Wert</th><th>Energie</th><th>Steuer</th><th>Level</th></tr>'; for (var i = 0; i< opt.series[0].data.length;i++) { table += "<tr>"; for(let x =0; x < opt.series[0].data[i].value.length; x++){ if(x==0){ table += "<td>" + ("0"+new Date(opt.series[0].data[i].value[x]).getHours()).slice(-2) + "</td>"; }else{ table += "<td>" + opt.series[0].data[i].value[x] + "</td>"; } } table += "</tr>"; } table += "</tbody></table>"; return table; }, readOnly: true }, } }, xAxis: { type: "time", axisLabel: { show: true, formatter: function (value) { return formatTime(value); } }, splitNumber: 10, }, yAxis: { type: "value", axisLabel: { formatter: function (value) { return value.toFixed(3) + " €"; } }, min: 0.36, max: 0.55, }, series: [{ z:1, data: data.map(function (item) { var hour = new Date(item.time).getHours(); var day = new Date(item.time).getDate(); return { value: [item.time, item.value, item.energy, item.tax, item.level], symbol: "circle", symbolSize: day === currentDay && hour === currentHour ? 10:null, itemStyle: { borderColor: day === currentDay && hour === currentHour ? "white":null, shadowColor: day === currentDay && hour === currentHour ? "white":null, borderWidth: day === currentDay && hour === currentHour ? 2:null, shadowBlur: day === currentDay && hour === currentHour ? 20:null, }, emphasis: { itemStyle: { color: "white" }, label: { show: true, formatter: function (params) { return params.data.value[1].toFixed(3) + " €"; }, color: "black", fontWeight: "bold", backgroundColor: "white" } } } }), step: "end", areaStyle:{ color: new echarts.graphic.LinearGradient(0, 1, 0, 0, colorStops), }, type: "line", markLine: { symbol: "none", lineStyle: { color: "red", type: "dashed" }, z:0, data: [ {yAxis: minValue ,name: "MIN", lineStyle: { color: "lime" },label: { show: true, position: "end", formatter: "Min\n"+ minValue.toFixed(3)+" €",textStyle: { fontSize: 12,fontWeight: "bold", color:"white" } } }, {yAxis: maxValue,name: "MAX", lineStyle: { color: "red" },label: { show: true, position: "end", formatter: "Max\n"+ maxValue.toFixed(3)+" €",textStyle: { fontSize: 12,fontWeight: "bold", color:"white" } } }, {yAxis: avgValue ,name: "AVG", lineStyle: { color: "blue" },label: { show: true, position: "end", formatter: "Avg\n"+ avgValue.toFixed(3)+" €",textStyle: { fontSize: 12,fontWeight: "bold", color:"white" } } }, ], }, }], tooltip: { trigger: "axis", axisPointer: { type: "shadow" }, textStyle: { fontFamily: "Courier", fontWeight: "bold" }, formatter: function (params) { let time = "Start ab: "+ moment(params[0].axisValue).format("HH:mm")+ " Uhr"; let value = "Preis:    "+params[0].value[1].toFixed(4) + " €"; let energy = "Energie:  "+params[0].value[2].toFixed(4) + " €"; let tax = "Steuer:   "+params[0].value[3].toFixed(4) + " €"; let lev = "Level:    "+ params[0].value[4]; return `${time}<br/>${value}<br/>${energy}<br/>${tax}<br/>${lev}` ; } }, }) } updateChart(); var updateInterval = setInterval(updateChart, 3600000);</script></body></html>Diese Meldung kommt im F12 Menu:
13:18:14.304 App Welcome to jarvis v3.1.8 index-2c99918a.js:112:44201
13:18:14.308 App using instance 0. index-2c99918a.js:112:45143
13:18:14.344
TypeError: a.default.detectStore(...) is undefined
h1-check.js:1:1301
13:18:16.330 App Sentry is turned on. You may deactivate it in the adapter settings. index-2c99918a.js:112:38413
13:37:24.569
Uncaught TypeError: colorStops[(colorStops.length - 1)] is undefined
    updateChart about:srcdoc:1
    <anonymous> about:srcdoc:1
srcdoc:1:4775
13:37:24.571
Uncaught TypeError: colorStops[(colorStops.length - 1)] is undefined
    updateChart about:srcdoc:1
    <anonymous> about:srcdoc:1
an was kann das liegen?

Pro Version habe ich in v 3.1.8
-
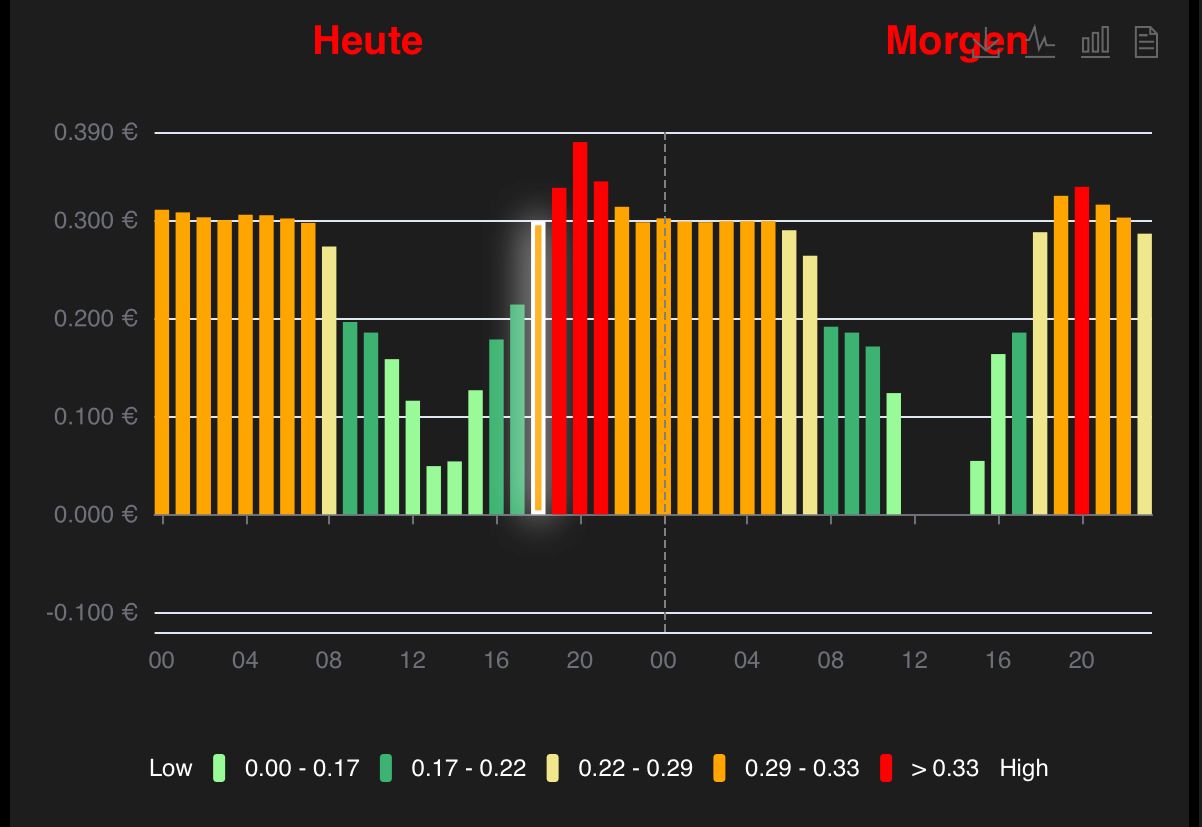
@m-a-hueb Du musst die Werte im DP colorJSON anpassen, dort sind sie nur bis 0.35 definiert.

Deine Werte gehen bis 0.53, dafür ist nichts definiert.
Ausserdem gibt jetzt mit der neuen tibberlink-Version ein dazugehöriges flexCharts. -
@mcu ist gt nicht greater than? dann müsste das doch bei 0.53 rot sein
[
  {
    "gt": 0,
    "lte": 0.15,
    "color": "lightgreen"
  },
  {
    "gt": 0.15,
    "lte": 0.22,
    "color": "green"
  },
  {
    "gt": 0.22,
    "lte": 0.29,
    "color": "yellow"
  },
  {
    "gt": 0.29,
    "lte": 0.35,
    "color": "orange"
  },
  {
    "gt": 0.35,
    "color": "red"
  }
]
Wo finde ich den FlexChart? ich seh da nix im Adapter
-
@m-a-hueb flexcharts ist ein neuer Adapter.
https://forum.iobroker.net/topic/76137/test-adapter-flexcharts-stapeldiagramme-und-mehr/174
Ja, muss ich mir näher anschauen.
Also, wenn alle Werte niedriger sind als die Tibberwerte, dann kommt es zu dem Fehler.
-
@mcu Danke für die Erklärung
-
@mcu
Der Fehler tritt nur auf, wenn alle Preise in die letzte Preisdefinition fallen, also alles größer als. Setzt man die vorletzte Preispanne in den Bereich der zur Zeit "günstigsten" Stunde, wird alles korrekt angezeigt. Ging letztes Jahr auch auf 3 Euro/Stunde, ohne das ich diese Preisschwelle definiert hatte. -
@quarkmax Ok, hab es angepasst gleiche Version 1.0.30
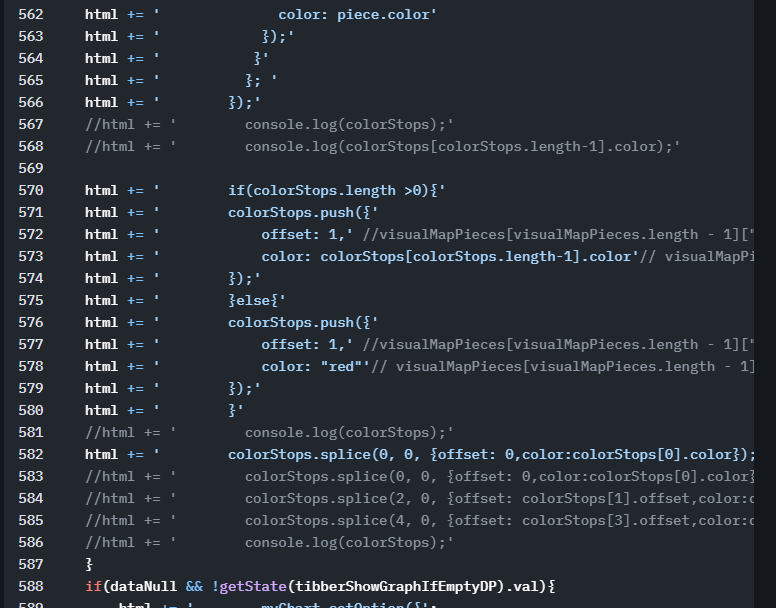
Man kann es einfach in dem Programm ab Zeile ~ 570 anpassen.html += ' if(colorStops.length >0){' html += ' colorStops.push({' html += ' offset: 1,' html += ' color: colorStops[colorStops.length-1].color' html += ' });' html += ' }else{' html += ' colorStops.push({' html += ' offset: 1,' html += ' color: "red"' html += ' });' html += ' }' -
Können bitte alle, die das Programm noch nutzen und nicht flexCharts, diesen Post hochvoten, damit ich abschätzen kann, ob sich eine Weiterentwicklung lohnt?
Danke. -
@mcu
Läuft.Großes Danke
-
@mcu
Was ist flexcharts?Tibber hat gerade angekündigt auf 15min-Intervalle zu wechseln, da wäre also noch eine Anpassung nötig.
Bisher läuft das Script wunderbar.Grüße, Mika
-
@mike42 Statt 1Stunden Tarife gibt es dnn 15min Tarife? Oder wird dann alle 15 min aktualisiert?
Was ist flexcharts?
https://github.com/MyHomeMyData/ioBroker.flexcharts
flexcharts ist ein eigener Adapter, mit dem man jegliches eCharts erstellen kann, auch die, die man mit Jarvis oder eCharts-Adapter nicht erstellen kann, da dort die Einstellungen fehlen.
-
@mcu said in Jarvis 3.1.8 - zukünftige Strompreise - Skalierung, Farben:
Statt 1Stunden Tarife gibt es dnn 15min Tarife? Oder wird dann alle 15 min aktualisiert?
Wie genau Tibber das bei der Api Abfrage realisiert weiß noch keiner genau. Tibber hat bisher nur angekündigt ab Juni auf 15min Intervalle umzustellen. D.H. das sich der Preis alle 15min ändert.
Inwieweit da die verschiedenen Abfrage Modelle der Api betroffen sind und wie die Darstellung dann aussehen soll kann man noch garnicht sagen. -
@icebear Joh, schauen wir mal… denke wir sollten erstmal sehen, wie das der Tibberlink-Adapter verdaut…
-
-
@mike42 Schick mal bitte die Daten dazu
-
@mcu hier die Daten für morgen
tibberlink.0.Homes.xyz.PricesTomorrow.json
bei mir läuft "tibberHTML v1.0.30"
-
@mike42 Du musst die negativen Werte in
0_userdata.0.tibberHistory.colorJSONsetzen
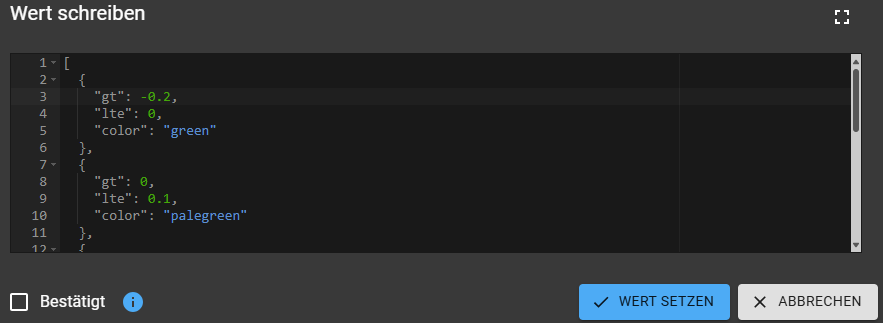
-
@mcu das stimmt - danke, daran hatte ich gar nicht mehr gedacht...