Navigation

    Logo
    • Register
    • Login
    • Search
    • Recent
    • Tags
    • Unread
    • Categories
    • Unreplied
    • Popular
    • GitHub
    • Docu
    • Hilfe
    1. Home
    2. Deutsch
    3. ioBroker Allgemein
    4. Mitsubishi Heavy Industries Split Klimaanlage

    NEWS

    • ioBroker@Smart Living Forum Solingen, 14.06. - Agenda added

    • ioBroker goes Matter ... Matter Adapter in Stable

    • Monatsrückblick - April 2025

    Mitsubishi Heavy Industries Split Klimaanlage

    This topic has been deleted. Only users with topic management privileges can see it.
    • S
      saeft_2003 Most Active @hacki11 last edited by

      @hacki11 sagte in Mitsubishi Heavy Industries Split Klimaanlage:

      @saeft_2003 Es wird im angegebenen Interval abgefragt. Bei einer erfolgreichen Abfrage wird der Datenpunkt "online" auf true gesetzt. Bei jedem Intervall werden am Ende alle online Datenpunkte evaluiert und sofern alle true sind, wird der Gesamstatus auch aktualisiert. So sollte sich der Zustand auch ohne Neustart wieder fangen. Du könntest das nächste mal schauen, ob alle online Datenpunkte der aktiven Geräte true sind und der Adapterzustand dennoch gelb.

      Alles klar falls das wieder vorkommt mache ich das.

      1 Reply Last reply Reply Quote 0
      • S
        saeft_2003 Most Active last edited by

        Denke ich habs. Intervall ping alle 60 sek?

        Screenshot 2025-05-15 111216.png

        1 Reply Last reply Reply Quote 0
        • H
          hacki11 last edited by

          @saeft_2003 Jede Sekunde

          S 1 Reply Last reply Reply Quote 0
          • S
            saeft_2003 Most Active @hacki11 last edited by

            @hacki11

            Das lässt der ping adapter nicht zu. kürzester intervall sind alle 5 sek.

            H 1 Reply Last reply Reply Quote 0
            • H
              hacki11 @saeft_2003 last edited by

              @saeft_2003 passt auch noch

              S 1 Reply Last reply Reply Quote 0
              • S
                saeft_2003 Most Active @hacki11 last edited by

                @hacki11

                Alles klar ich lass das mal bis morgen so laufen und schau ob ich in grafana was sehe und melde mich.

                1 Reply Last reply Reply Quote 0
                • S
                  saeft_2003 Most Active last edited by

                  @hacki11

                  So was war jetzt um 11:42 43 und 44? Keine Verbindung? Wieso?

                  IMG_6079.png IMG_6078.png IMG_6077.png

                  Thomas Braun H 2 Replies Last reply Reply Quote 0
                  • Thomas Braun
                    Thomas Braun Most Active @saeft_2003 last edited by

                    @saeft_2003

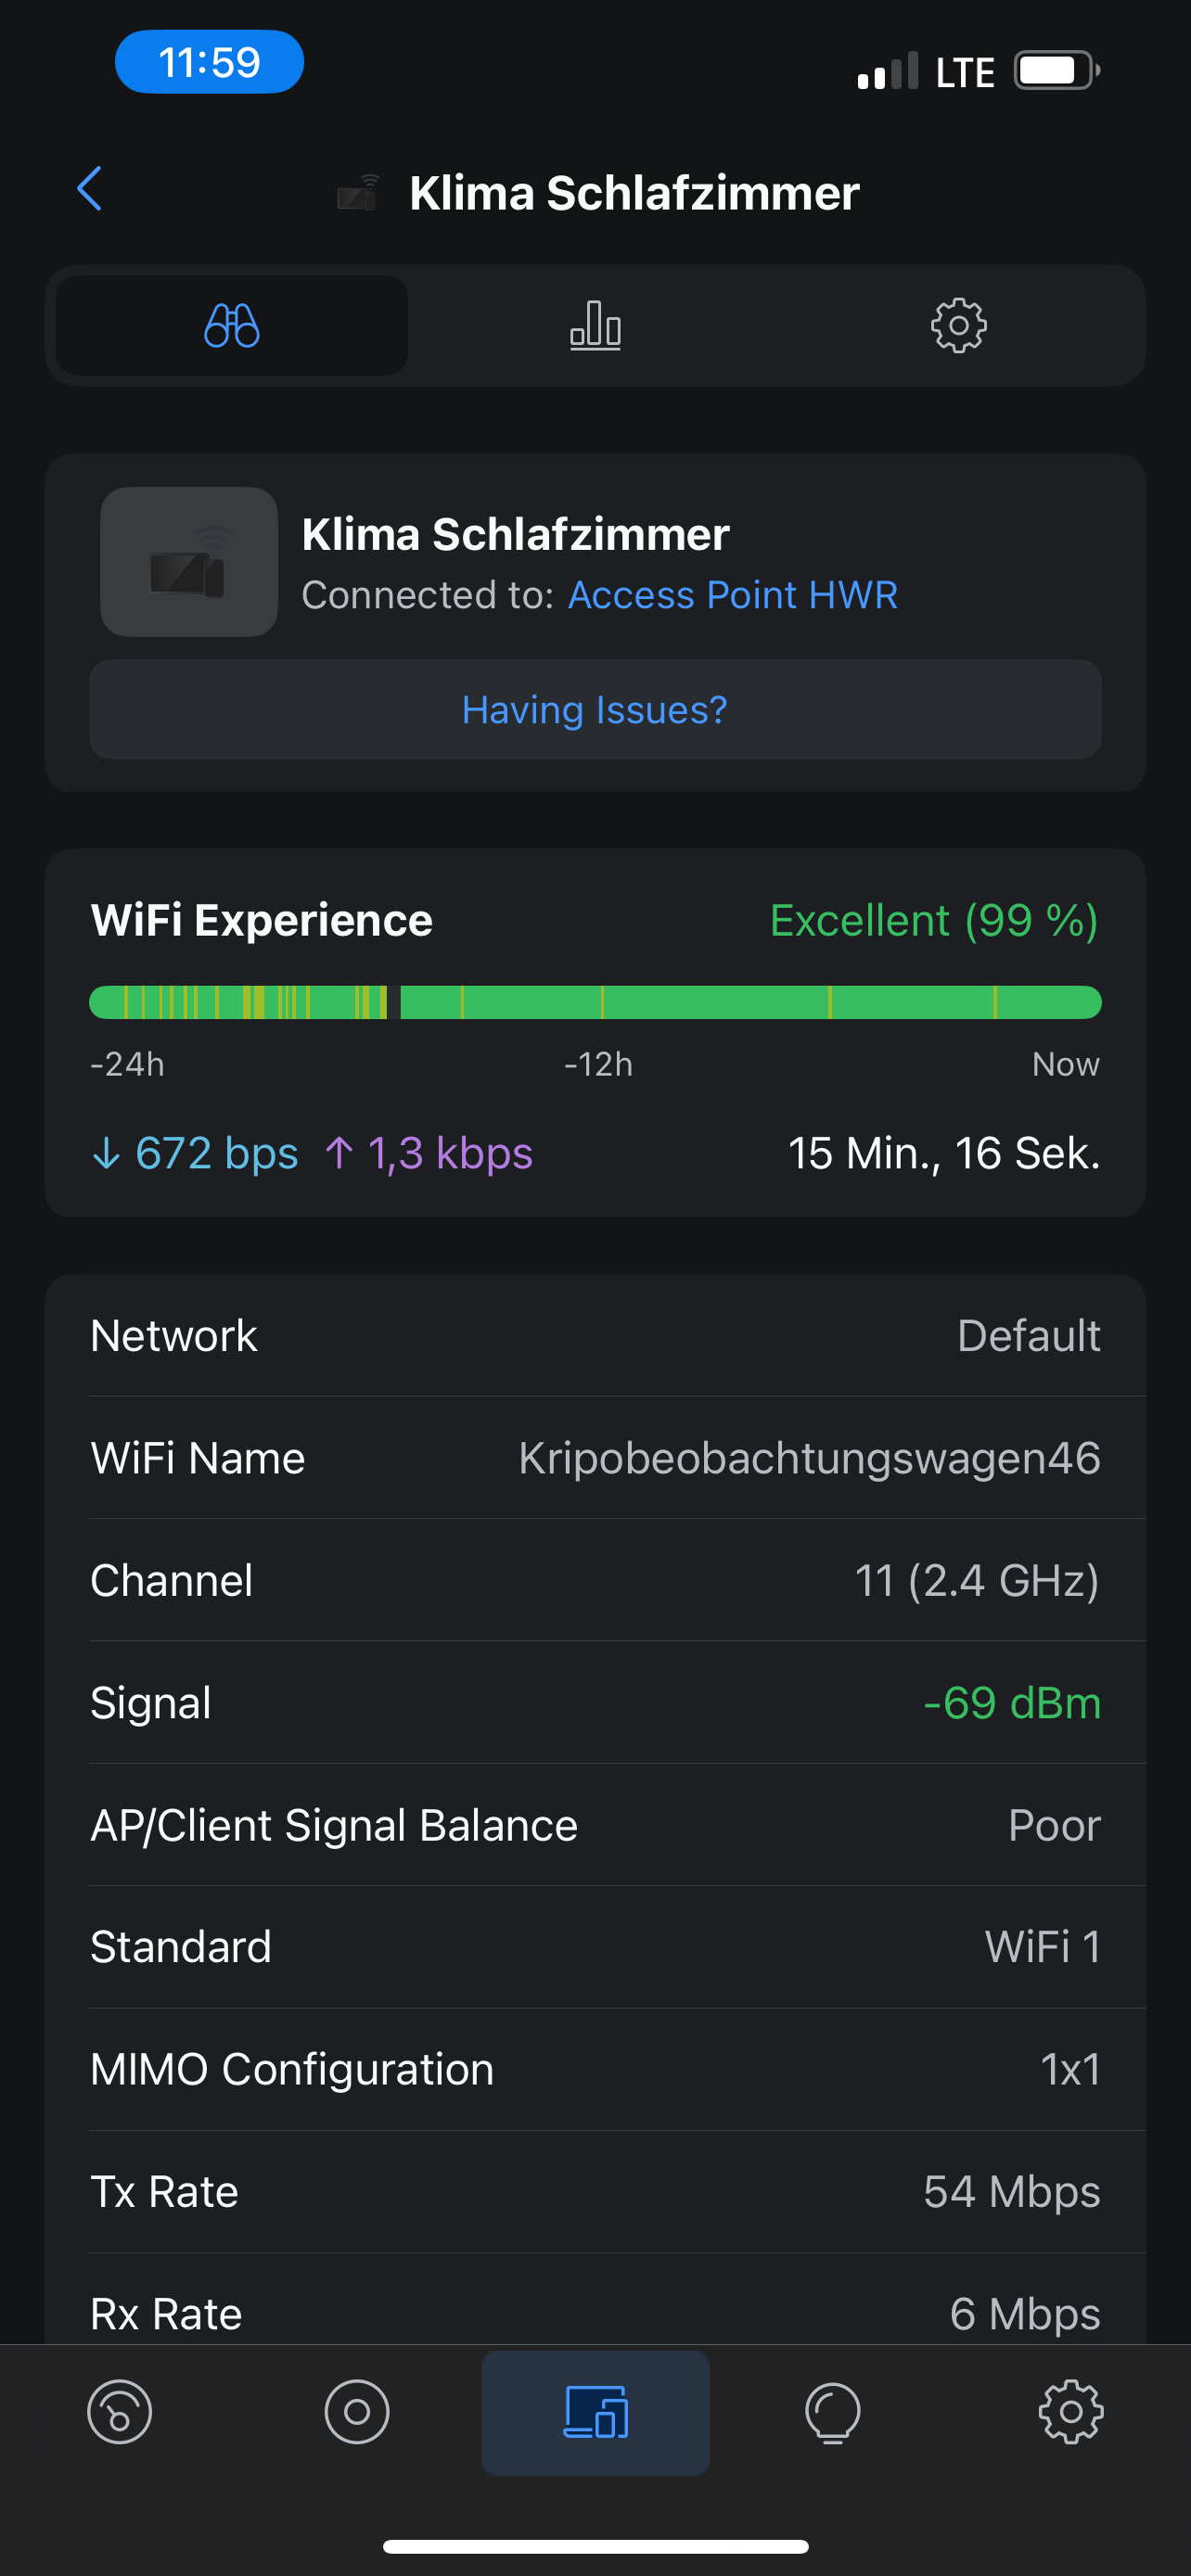
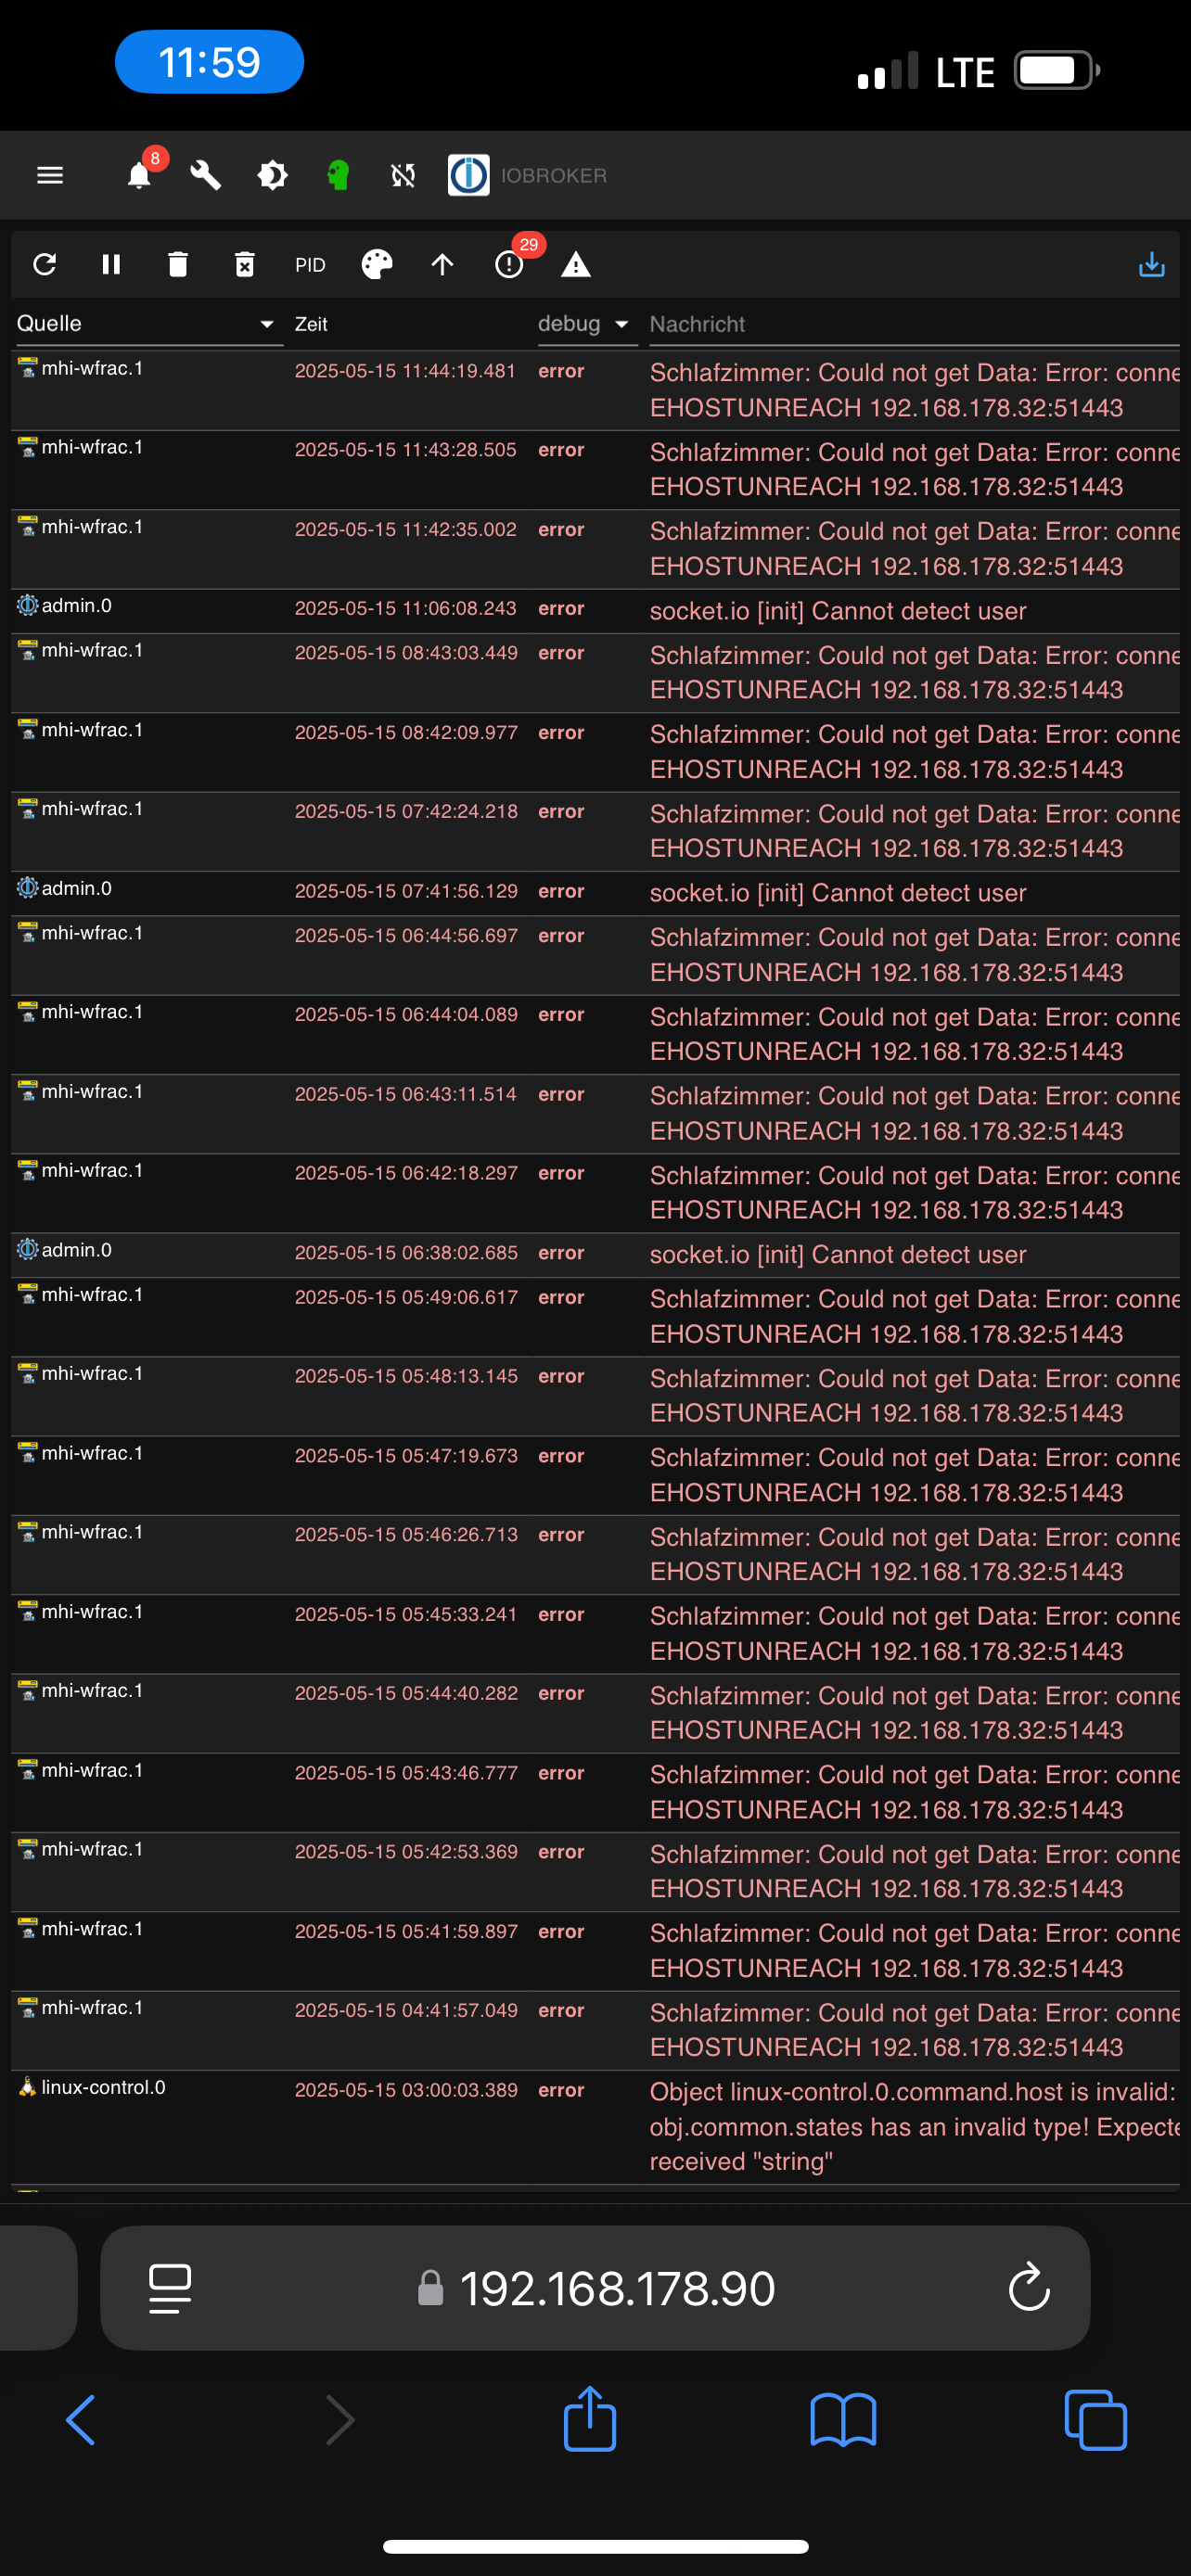
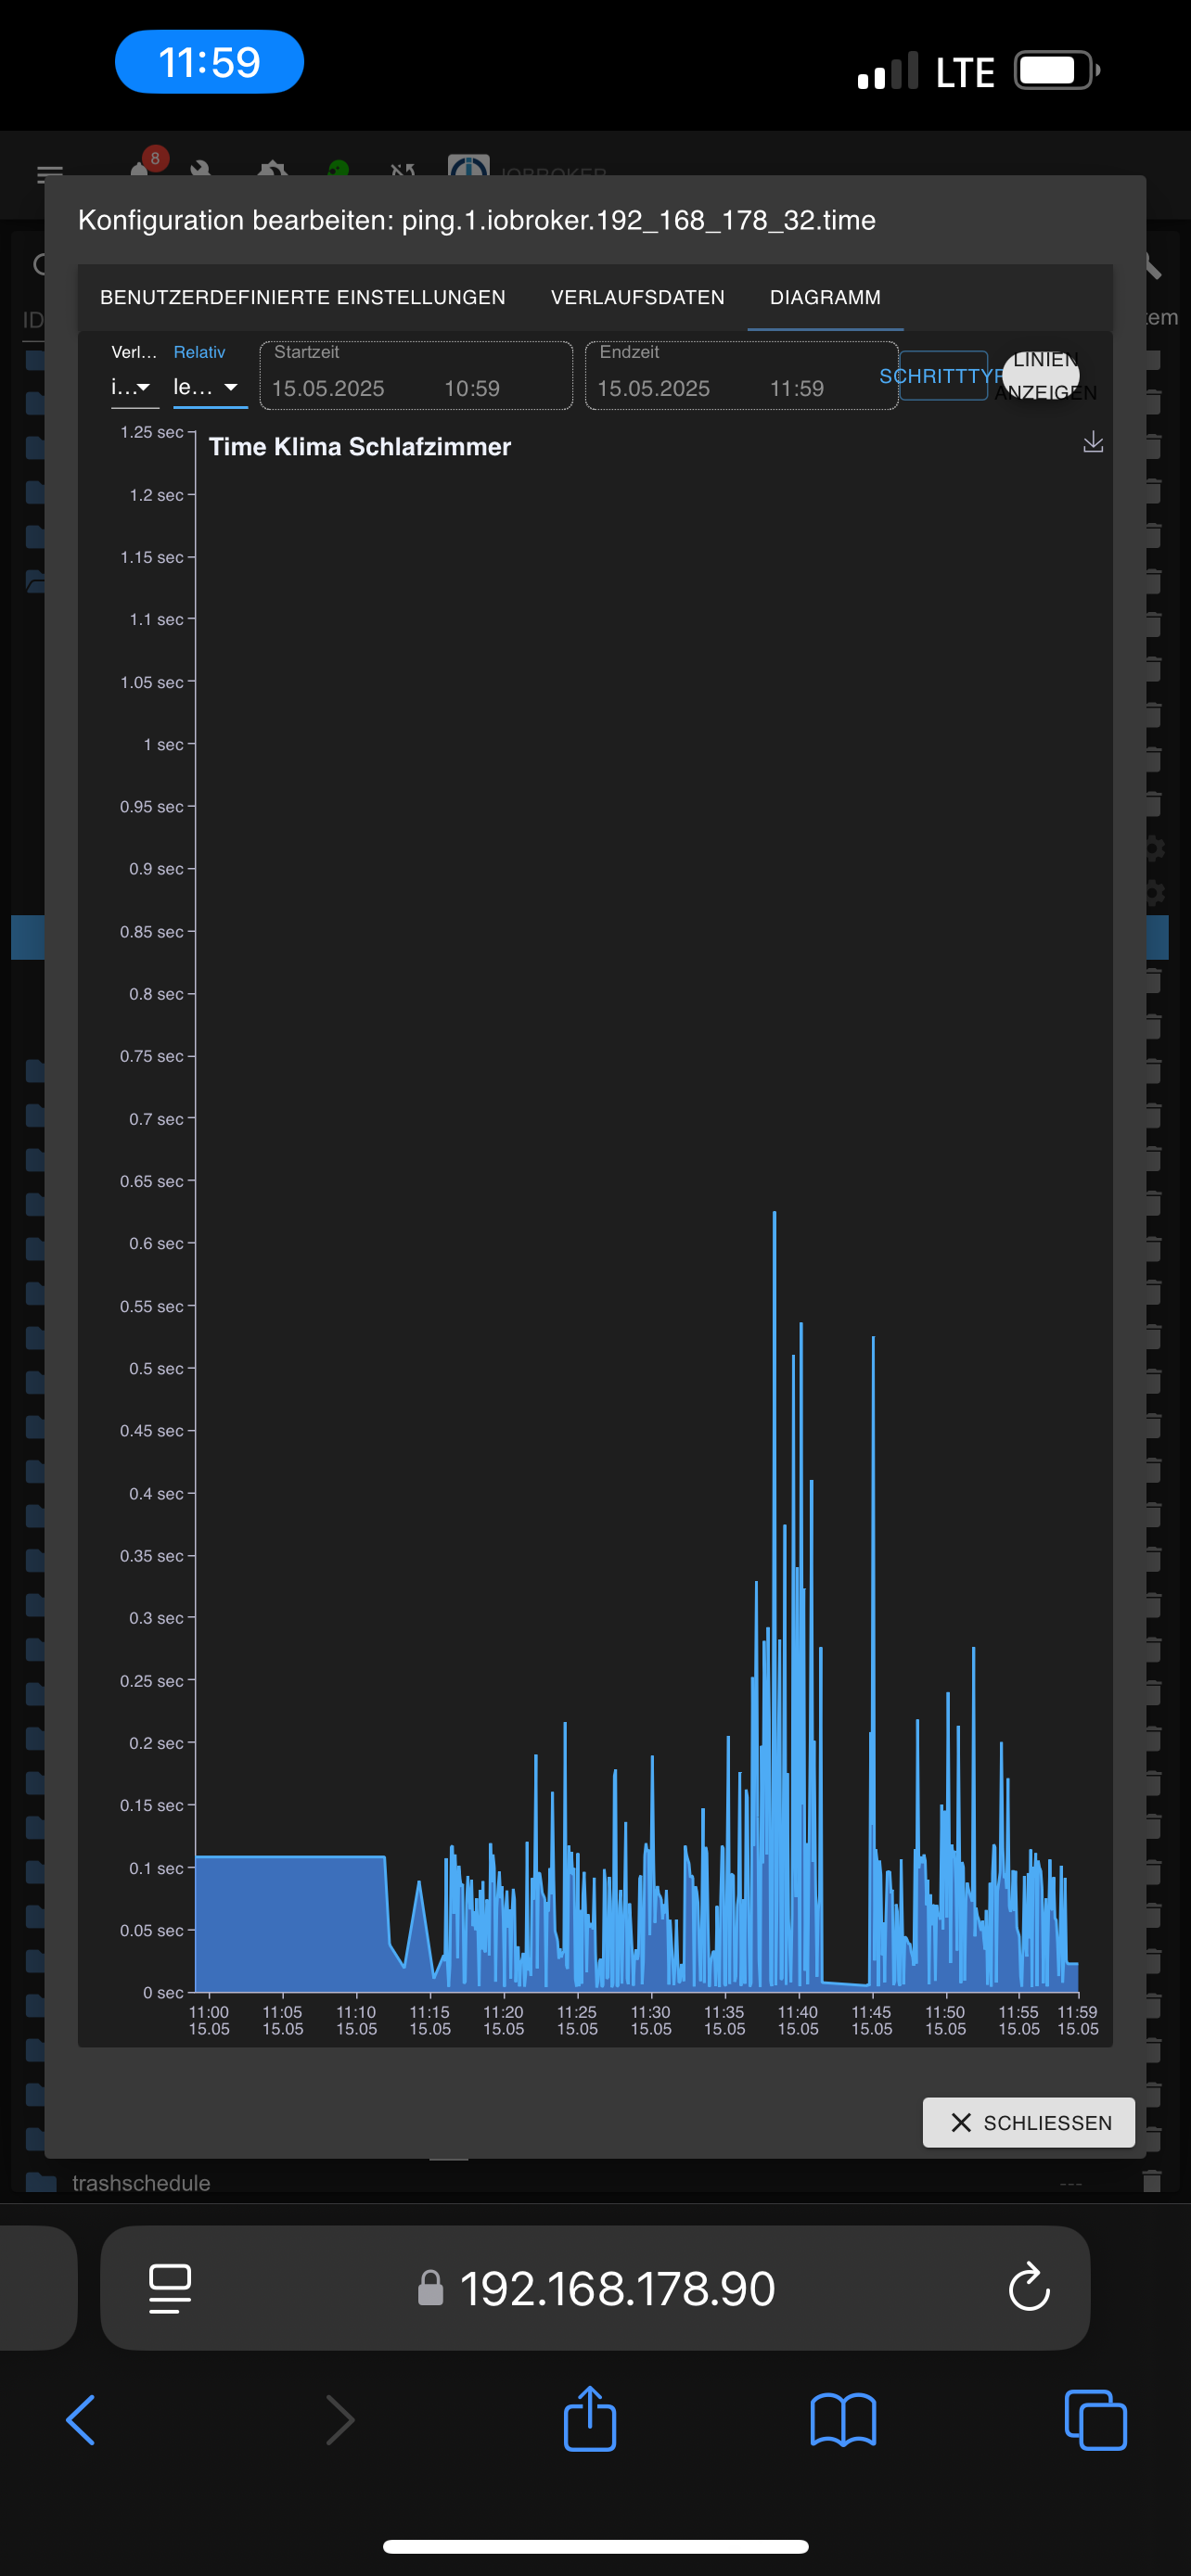
                    Das sieht mir nach einer schlechten WLAN-Verbindung aus.

                    1 Reply Last reply Reply Quote 0
                    • H
                      hacki11 @saeft_2003 last edited by

                      @saeft_2003 Nimm mal den alive mit in die history auf. Aber man sieht schon schön ne Lücke in dem Graphen. Vermutlich gab’s keine Werte und es wird linear mit dem ersten Ping der wiederkommt verbunden? Zumindest würde das den Graphen erklären.

                      1 Reply Last reply Reply Quote 0
                      • S
                        saeft_2003 Most Active last edited by

                        Ich hab die Klima jetzt wieder auf den AP gelockt der theoretisch am besten ist. Normalerweise muss die Verbindung hier top sein. Luftlinie ist der nur 2m weg und nur dünne Wände dazwischen. Andere Geräte zum Teil weiter weg haben null Probleme.

                        H 1 Reply Last reply Reply Quote 0
                        • H
                          hacki11 @saeft_2003 last edited by

                          @saeft_2003 Mein IG nimmt auch immer den weiter entfernten AP statt dem der 4m entfernt steht. Roaming ist in dem WLAN deaktiviert, da viele IOT Geräte damit nicht klar kommen. Das IG vermutlich gleich dreimal nicht.

                          MrLarodos 1 Reply Last reply Reply Quote 0
                          • MrLarodos
                            MrLarodos @hacki11 last edited by MrLarodos

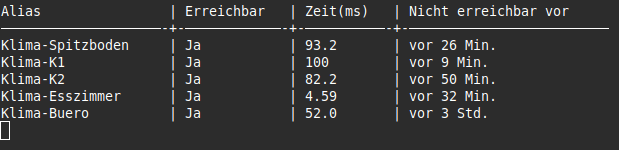
                            @hacki11 Ich habe das WLAN so konfiguriert, dass die Geräte in einem separaten WLAN in 2.4Ghz am jeweils nächstliegenden AP eingesperrt sind. Habe kurz ein Shellscript für Linux mit Chat GPT entwickelt, was ne csv mitloggt (im Subfolder "Log" im Scriptordner. Inhalt der CSV:

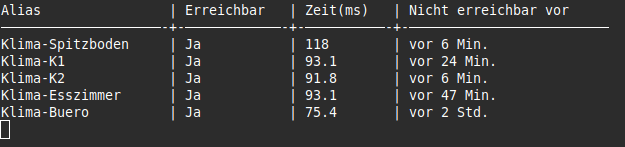
                            Name;Zeitstempel;Erreichbar;Zeit(ms)
                            Klima-Spitzboden;2025-05-15 13:39:18;True;30.4
                            Klima-K1;2025-05-15 13:39:18;True;85.3
                            Klima-K2;2025-05-15 13:39:18;True;95.8
                            

                            Ist auch ein Billigfrontend drauf:
                            6f150060-cc27-493e-a71d-e04fd9d3fcbe-grafik.png

                            Hier das Script (IPs und Aliase anpassen!):

                            #!/bin/bash
                            
                            # Intervall in Sekunden
                            INTERVAL=5
                            
                            # IP-Adressen und Aliasnamen
                            IPS=("192.168.120.135" "192.168.120.138" "192.168.120.137" "192.168.120.136" "192.168.120.166")
                            ALIASES=("Klima-Spitzboden" "Klima-K1" "Klima-K2" "Klima-Esszimmer" "Klima-Buero")
                            
                            # Logging-Verzeichnis und -Datei
                            SCRIPT_DIR="$(cd "$(dirname "${BASH_SOURCE[0]}")" && pwd)"
                            LOG_DIR="$SCRIPT_DIR/log"
                            CSV_FILE="$LOG_DIR/ping_log.csv"
                            mkdir -p "$LOG_DIR"
                            
                            # CSV-Datei initialisieren, falls noch nicht vorhanden
                            if [ ! -f "$CSV_FILE" ]; then
                                echo "Name;Zeitstempel;Erreichbar;Zeit(ms)" >> "$CSV_FILE"
                            fi
                            
                            # Statusspeicher
                            declare -A LAST_RESPONSE
                            declare -A LAST_SEEN_DOWN
                            
                            # Spaltenbreiten
                            WIDTH_ALIAS=20
                            WIDTH_REACH=12
                            WIDTH_TIME=10
                            WIDTH_LASTDOWN=25
                            
                            # Initialisieren
                            for alias in "${ALIASES[@]}"; do
                                LAST_RESPONSE["$alias"]="-"
                                LAST_SEEN_DOWN["$alias"]="-"
                            done
                            
                            # Letzte bekannte False-Zeiten aus CSV rekonstruieren
                            if [ -f "$CSV_FILE" ]; then
                                for alias in "${ALIASES[@]}"; do
                                    last_false=$(grep "^$alias;" "$CSV_FILE" | grep ";False;" | tail -n 1 | cut -d';' -f2)
                                    if [ -n "$last_false" ]; then
                                        epoch=$(date -d "$last_false" +%s 2>/dev/null)
                                        if [ -n "$epoch" ]; then
                                            LAST_SEEN_DOWN["$alias"]=$epoch
                                        fi
                                    fi
                                done
                            fi
                            
                            # Funktion für menschenlesbare Zeitangabe
                            time_diff_human() {
                                local last_time=$1
                                [[ "$last_time" == "-" ]] && echo "-" && return
                                local now=$(date +%s)
                                local diff=$((now - last_time))
                                (( diff < 60 )) && echo "vor $diff Sek." && return
                                (( diff < 3600 )) && echo "vor $((diff / 60)) Min." && return
                                echo "vor $((diff / 3600)) Std."
                            }
                            
                            # Hauptschleife
                            while true; do
                                clear
                            
                                printf "%-${WIDTH_ALIAS}s | %-${WIDTH_REACH}s | %-${WIDTH_TIME}s | %-${WIDTH_LASTDOWN}s\n" "Alias" "Erreichbar" "Zeit(ms)" "Nicht erreichbar vor"
                                printf "%-${WIDTH_ALIAS}s-+-%-${WIDTH_REACH}s-+-%-${WIDTH_TIME}s-+-%-${WIDTH_LASTDOWN}s\n" \
                                    "$(printf '─%.0s' $(seq 1 $WIDTH_ALIAS))" \
                                    "$(printf '─%.0s' $(seq 1 $WIDTH_REACH))" \
                                    "$(printf '─%.0s' $(seq 1 $WIDTH_TIME))" \
                                    "$(printf '─%.0s' $(seq 1 $WIDTH_LASTDOWN))"
                            
                                for i in "${!IPS[@]}"; do
                                    IP=${IPS[$i]}
                                    NAME=${ALIASES[$i]}
                                    TIMESTAMP_HUMAN=$(date '+%Y-%m-%d %H:%M:%S')
                                    TIMESTAMP_EPOCH=$(date +%s)
                                    PING_OUTPUT=$(ping -c 1 -W 1 "$IP" 2>/dev/null)
                            
                                    if echo "$PING_OUTPUT" | grep -q "1 received"; then
                                        TIME_MS=$(echo "$PING_OUTPUT" | grep "time=" | sed -E 's/.*time=([0-9.]+) ms/\1/')
                                        LAST_RESPONSE["$NAME"]=$TIME_MS
                                        REACH="Ja"
                                        DOWNTIME=$(time_diff_human "${LAST_SEEN_DOWN[$NAME]}")
                                        echo "$NAME;$TIMESTAMP_HUMAN;True;$TIME_MS" >> "$CSV_FILE"
                                    else
                                        REACH="Nein"
                                        TIME_MS="-"
                                        if [[ "${LAST_SEEN_DOWN[$NAME]}" == "-" ]]; then
                                            LAST_SEEN_DOWN["$NAME"]=$TIMESTAMP_EPOCH
                                        fi
                                        DOWNTIME=$(time_diff_human "${LAST_SEEN_DOWN[$NAME]}")
                                        echo "$NAME;$TIMESTAMP_HUMAN;False;" >> "$CSV_FILE"
                                    fi
                            
                                    printf "%-${WIDTH_ALIAS}s | %-${WIDTH_REACH}s | %-${WIDTH_TIME}s | %-${WIDTH_LASTDOWN}s\n" \
                                        "$NAME" "$REACH" "${LAST_RESPONSE[$NAME]}" "$DOWNTIME"
                                done
                            
                                sleep "$INTERVAL"
                            done
                            

                            Falls Ihr irgendwo Linux habt, könnt Ihr das da laufen lassen.

                            Und hier das Script, um die CSV als Bild darzustellen:

                            #!/usr/bin/env python3
                            
                            import pandas as pd
                            import matplotlib.pyplot as plt
                            from datetime import timedelta
                            import matplotlib.dates as mdates
                            import os
                            
                            # 🕒 Benutzerabfrage zum Stundenbereich
                            try:
                                user_input = input("Wie viele Stunden zurück anzeigen? [Default: 24]: ").strip()
                                MAX_HOURS = int(user_input) if user_input else 24
                            except Exception:
                                MAX_HOURS = 24
                            
                            # 📥 CSV einlesen
                            CSV_PATH = "./log/ping_log.csv"
                            df = pd.read_csv(CSV_PATH, sep=';')
                            df['Zeitstempel'] = pd.to_datetime(df['Zeitstempel'], format="%Y-%m-%d %H:%M:%S")
                            df['Farbe'] = df['Erreichbar'].apply(lambda x: 'green' if str(x).strip().lower() == 'true' else 'red')
                            df['Erreichbar_bool'] = df['Erreichbar'].apply(lambda x: str(x).strip().lower() == 'true')
                            
                            # 🧭 Zeitbereich setzen
                            latest_time = df['Zeitstempel'].max()
                            earliest_time = df['Zeitstempel'].min()
                            start_time = max(earliest_time, latest_time - timedelta(hours=MAX_HOURS))
                            df = df[df['Zeitstempel'] >= start_time].copy()
                            
                            # 📋 Aliasnamen extrahieren
                            aliases = df['Name'].unique()
                            aliases_sorted = list(aliases)
                            
                            # 📁 Diagrammverzeichnis erstellen
                            output_dir = "./diagramm_pix"
                            os.makedirs(output_dir, exist_ok=True)
                            
                            # 📊 Plot vorbereiten
                            fig, ax = plt.subplots(figsize=(14, len(aliases_sorted) * 1.2))
                            
                            def plot_status_blocks(data, y_pos):
                                current_color = None
                                block_start = None
                                for _, row in data.iterrows():
                                    color = row['Farbe']
                                    timestamp = row['Zeitstempel']
                                    if color != current_color:
                                        if current_color is not None:
                                            duration = (timestamp - block_start).total_seconds()
                                            ax.barh(
                                                y=y_pos,
                                                width=duration / 3600,
                                                left=block_start,
                                                height=0.6,
                                                color=current_color,
                                                edgecolor='none'
                                            )
                                        block_start = timestamp
                                        current_color = color
                                if block_start is not None and current_color is not None:
                                    duration = (latest_time - block_start).total_seconds()
                                    ax.barh(
                                        y=y_pos,
                                        width=duration / 3600,
                                        left=block_start,
                                        height=0.6,
                                        color=current_color,
                                        edgecolor='none'
                                    )
                            
                            for i, alias in enumerate(aliases_sorted):
                                data = df[df['Name'] == alias].sort_values(by='Zeitstempel')
                                plot_status_blocks(data, i)
                            
                            # 📐 Achsen und Format
                            ax.set_yticks(range(len(aliases_sorted)))
                            ax.set_yticklabels(aliases_sorted)
                            ax.set_xlim(start_time, latest_time)
                            ax.invert_yaxis()
                            ax.xaxis.set_major_formatter(mdates.DateFormatter('%H:%M'))
                            ax.set_xlabel("Uhrzeit")
                            ax.set_title("Erreichbarkeit der IPs – zusammenhängende Zustandsbereiche")
                            plt.grid(axis='x', linestyle='--', alpha=0.5)
                            plt.tight_layout()
                            
                            # 💾 Bild speichern
                            image_filename = f"{output_dir}/ping_status_{latest_time.strftime('%Y%m%d_%H%M%S')}.png"
                            plt.savefig(image_filename)
                            plt.show()
                            
                            # 📋 Zusammenfassung pro Alias
                            print("\nZusammenfassung:")
                            total_minutes = MAX_HOURS * 60
                            
                            for alias in aliases_sorted:
                                alias_data = df[df['Name'] == alias].sort_values(by='Zeitstempel')
                                alias_data['diff'] = alias_data['Zeitstempel'].diff().dt.total_seconds().fillna(0)
                            
                                # Statuswechsel ermitteln
                                alias_data['is_new_block'] = (alias_data['Erreichbar_bool'] != alias_data['Erreichbar_bool'].shift())
                                alias_data['block_id'] = alias_data['is_new_block'].cumsum()
                            
                                # Offline-Blöcke
                                false_blocks = alias_data[alias_data['Erreichbar_bool'] == False]
                                grouped = false_blocks.groupby('block_id')
                            
                                total_offline_secs = grouped['diff'].sum().sum()
                                total_offline_minutes = round(total_offline_secs / 60, 2)
                            
                                total_outages = grouped.ngroups
                                outages_per_hour = round(total_outages / MAX_HOURS, 2)
                                avg_offline_per_hour = round(total_offline_minutes / MAX_HOURS, 2)
                            
                                # Antwortzeiten nur bei True
                                true_responses = alias_data[alias_data['Erreichbar_bool'] == True].copy()
                                true_responses['Zeit(ms)'] = pd.to_numeric(true_responses['Zeit(ms)'], errors='coerce')
                                min_time = round(true_responses['Zeit(ms)'].min(), 2)
                                avg_time = round(true_responses['Zeit(ms)'].mean(), 2)
                                max_time = round(true_responses['Zeit(ms)'].max(), 2)
                            
                                print(f"{alias}:")
                                print(f"  Gesamtofflinezeit:       {total_offline_minutes:.2f} Min")
                                print(f"  Ø Offlinezeit/Stunde:    {avg_offline_per_hour:.2f} Min")
                                print(f"  Gesamtzahl Ausfälle:     {total_outages}")
                                print(f"  Ø Ausfälle/Stunde:       {outages_per_hour}")
                                print(f"  Antwortzeit (Min/Ø/Max): {min_time:.2f} / {avg_time:.2f} / {max_time:.2f} ms\n")
                            
                            MrLarodos 1 Reply Last reply Reply Quote 0
                            • MrLarodos
                              MrLarodos @MrLarodos last edited by MrLarodos

                              @mrlarodos Habe mir noch ein Script gebaut, das die CSV als Diagramm visualisiert:
                              0cae9fa0-2530-432a-a78e-056fb5f6e743-ping_status_20250515_193136.png

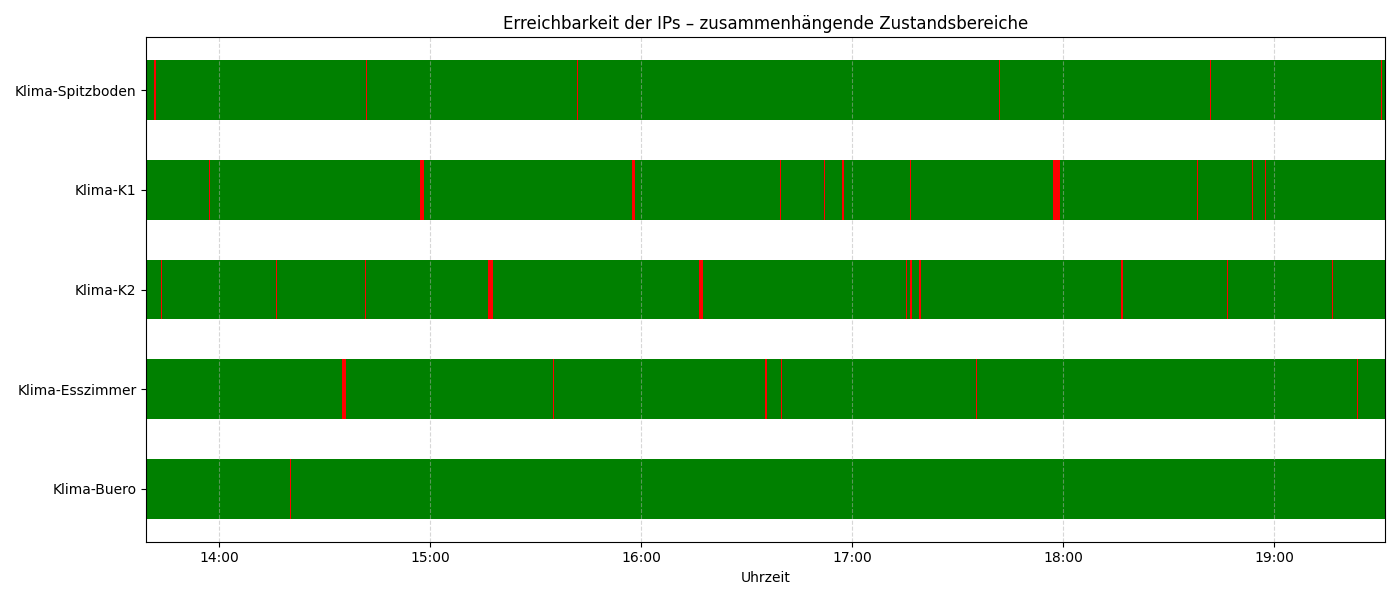
                              Und hier die Zusammenfassung der bisherigen Messung:
                              Klima-Spitzboden:
                              Gesamtofflinezeit: 3.50 Min
                              Ø Offlinezeit/Stunde: 0.15 Min
                              Gesamtzahl Ausfälle: 19
                              Ø Ausfälle/Stunde: 0.79
                              Antwortzeit (Min/Ø/Max): 4.30 / 82.30 / 878.00 ms

                              Klima-K1:
                              Gesamtofflinezeit: 6.25 Min
                              Ø Offlinezeit/Stunde: 0.26 Min
                              Gesamtzahl Ausfälle: 21
                              Ø Ausfälle/Stunde: 0.88
                              Antwortzeit (Min/Ø/Max): 4.09 / 77.67 / 452.00 ms

                              Klima-K2:
                              Gesamtofflinezeit: 6.42 Min
                              Ø Offlinezeit/Stunde: 0.27 Min
                              Gesamtzahl Ausfälle: 28
                              Ø Ausfälle/Stunde: 1.17
                              Antwortzeit (Min/Ø/Max): 3.88 / 85.14 / 680.00 ms

                              Klima-Esszimmer:
                              Gesamtofflinezeit: 3.35 Min
                              Ø Offlinezeit/Stunde: 0.14 Min
                              Gesamtzahl Ausfälle: 8
                              Ø Ausfälle/Stunde: 0.33
                              Antwortzeit (Min/Ø/Max): 3.74 / 78.01 / 979.00 ms

                              Klima-Buero:
                              Gesamtofflinezeit: 0.18 Min
                              Ø Offlinezeit/Stunde: 0.01 Min
                              Gesamtzahl Ausfälle: 2
                              Ø Ausfälle/Stunde: 0.08
                              Antwortzeit (Min/Ø/Max): 4.20 / 73.71 / 993.00 ms

                              Hm. Hilft uns das sehr? 🙂

                              H 1 Reply Last reply Reply Quote 0
                              • H
                                hacki11 @MrLarodos last edited by

                                @mrlarodos Zur Sicherheit mal den Adapter stoppen und prüfen ob die Offlinezeit dadurch beeinflusst wird. Falls nicht ist zumindest der Adapter raus 🫠

                                MrLarodos 1 Reply Last reply Reply Quote 0
                                • MrLarodos
                                  MrLarodos @hacki11 last edited by

                                  @hacki11 Gute Idee 🙂 Ich hoffe, dann ist alles grün 😬 <sleep canceled> ist dann angesagt 😆

                                  MrLarodos H 2 Replies Last reply Reply Quote 0
                                  • MrLarodos
                                    MrLarodos @MrLarodos last edited by

                                    @mrlarodos So, der Adapter ist aus. Nun wird es spannend 🙂
                                    c07d497a-7485-46c1-a821-a2732e978c28-grafik.png

                                    1 Reply Last reply Reply Quote 0
                                    • H
                                      hacki11 @MrLarodos last edited by

                                      @mrlarodos 😓

                                      MrLarodos 1 Reply Last reply Reply Quote 1
                                      • MrLarodos
                                        MrLarodos @hacki11 last edited by MrLarodos

                                        @hacki11 42ee90ec-5852-4fdd-8764-a38cdd49aaf6-grafik.png

                                        Ich lass mal noch ein paar Stunden laufen und dann checken wir. Ich vermute eher, dass die Verbindung von den Dingern einfach nicht besonders stabil ist. Büro besonders stabil, weil der AP 2 Meter in Sichtlinie liegt. Schauen wir mal.

                                        MrLarodos 1 Reply Last reply Reply Quote 0
                                        • MrLarodos
                                          MrLarodos @MrLarodos last edited by

                                          @mrlarodos So, um 20:20 Uhr hatte ich den Adapter deaktiviert:
                                          4ef83d4c-63d6-483f-a09f-afc6ddcb1e30-grafik.png
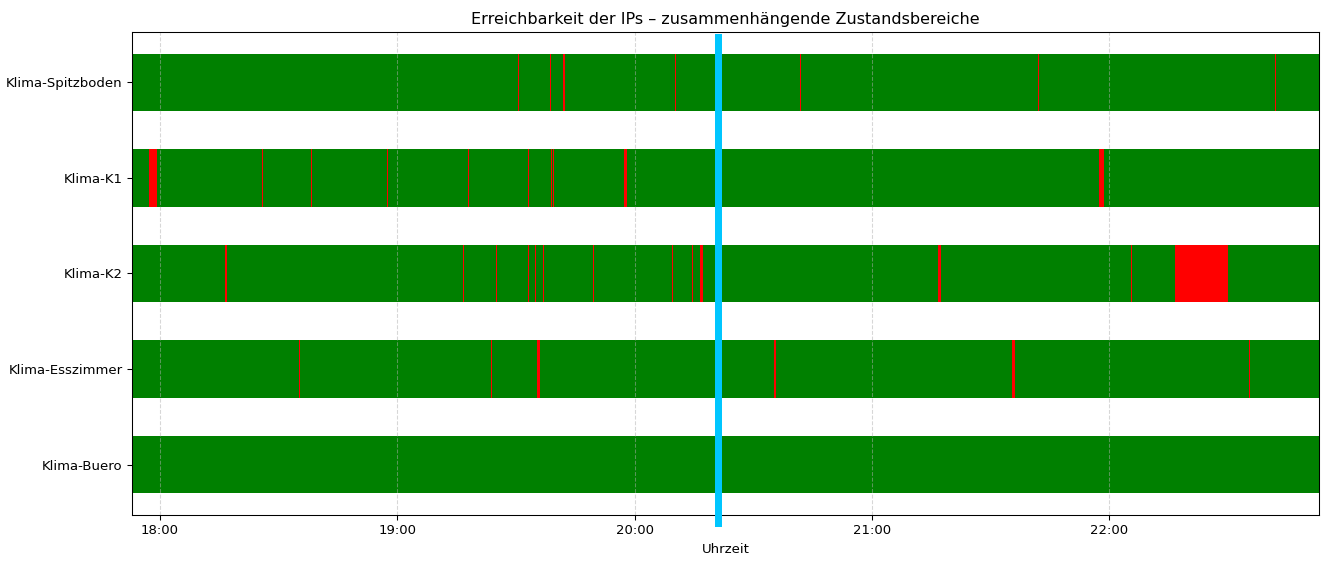
                                          Ab der blauen Linie also. Danach sind zwar weniger kleine Abbrüche erkennbar, aber das Phänomen ist nicht weg.

                                          Signalstärke ist bei Klima-K1, Klima-K2 und Spitzboden bei ca. -47 dBm / -50 dBm, also kein großer Unterschied und auch kein erklärend schlechter Wert, oder?

                                          Im Büro sind es -31 dBm und Esszimmer -35 dBm, da beide Sichtline zum AP haben. K1, K2 und Spitzboden sind auch nur 1 - 3 Meter vom AP entfernt, wenn auch ohne Sichtlinie.

                                          Feste Kopplung an den jeweils nächsten AP und separates, eigenes WLAN mit 2,4 Ghz. Bin da etwas ratlos und kann nur mutmaßen, dass die WLAN-Module einfach nicht sehr gut sind.

                                          Dass der Adapter runtergefahren ist, die Objekte aber weiterhin als online angezeigt werden, kannst Du nicht ändern, oder? Falls es möglich ist bei proaktivem Abschalten des Adapters auch noch ein Stopscript laufen zu lassen, wäre ein offline in den Objekten und der "Summe" wünschenswert 🙂

                                          Ansonsten kann man wohl nicht viel machen. Der fette Ausfall der Pingbarkeit von K2 ist schon Mist ...

                                          LG MrLarodos

                                          H 1 Reply Last reply Reply Quote 0
                                          • H
                                            hacki11 @MrLarodos last edited by hacki11

                                            @mrlarodos Ohne, dass der Adapter läuft kann man die Erreichbarkeit der IG nicht wissen. Offline ist hier dann genauso falsch wie online. Wie ist es denn bei den anderen Adaptern wie Shelly? Wird hier auch noch was vorm beenden verändert? Der letzte bekannte Zustand ist der beste den wir haben. Falls es um ne Vis geht bräuchte man evtl. den Adapterzustand oder?

                                            Ansonsten gut analysiert. Wer mag ein WLan Modul zerlegen, damit wir sehen was da drin ist? Vielleicht findet man auch noch Infos in englischsprachigen Foren.

                                            MrLarodos 1 Reply Last reply Reply Quote 0
                                            • First post
                                              Last post

                                            Support us

                                            ioBroker
                                            Community Adapters
                                            Donate
                                            FAQ Cloud / IOT
                                            HowTo: Node.js-Update
                                            HowTo: Backup/Restore
                                            Downloads
                                            BLOG

                                            1.1k
                                            Online

                                            31.7k
                                            Users

                                            79.7k
                                            Topics

                                            1.3m
                                            Posts

                                            20
                                            215
                                            22606
                                            Loading More Posts
                                            • Oldest to Newest
                                            • Newest to Oldest
                                            • Most Votes
                                            Reply
                                            • Reply as topic
                                            Log in to reply
                                            Community
                                            Impressum | Datenschutz-Bestimmungen | Nutzungsbedingungen
                                            The ioBroker Community 2014-2023
                                            logo