Navigation

    Logo
    • Register
    • Login
    • Search
    • Recent
    • Tags
    • Unread
    • Categories
    • Unreplied
    • Popular
    • GitHub
    • Docu
    • Hilfe
    1. Home
    2. Deutsch
    3. Skripten / Logik
    4. JavaScript
    5. HowTo: Zusatz-Programme fuer jarvis v3

    NEWS

    • Neues Video über Aliase, virtuelle Geräte und Kategorien

    • Wir empfehlen: Node.js 22.x

    • Neuer Blog: Fotos und Eindrücke aus Solingen

    HowTo: Zusatz-Programme fuer jarvis v3

    This topic has been deleted. Only users with topic management privileges can see it.
    • R
      recaremo @MCU last edited by

      @mcu 👍

      1 Reply Last reply Reply Quote 0
      • R
        recaremo last edited by

        Tolle Erweiterungen des Scriptes -inzwischen Tankerkönig 1.03.

        https://mcuiobroker.gitbook.io/jarvis-infos/jarvis-v3/system-effektprog./tankerkoenig#v1.0.3

        Vielen Dank.

        1 Reply Last reply Reply Quote 0
        • M
          MCU last edited by MCU

          @mabbi Übernommen von https://forum.iobroker.net/topic/39172/test-echarts-adapter/648

          Zeig mal die Presets in echarts.0 und die Objekteigenschaften zum echarts.0.D_Energie_copy. In CodeTags </>.

          Also echartDP muss schon mal '0_userdata.0.echarts'; sein, sonst kann es ja nicht funktionieren.

          858ff245-6058-4a53-b569-d856fffda85a-image.png

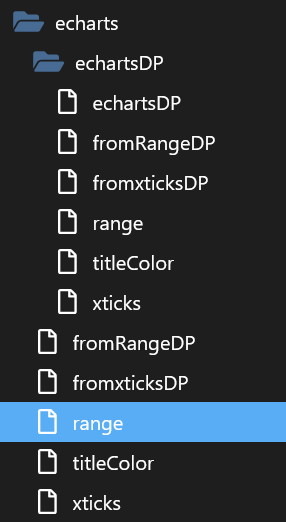
          Da hast du ein wenig mit dem echartDP gespielt -> muss du komplett löschen
          Und den echartDP so lassen wie er war -> '0_userdata.0.echarts';

          1 Reply Last reply Reply Quote 0
          • M
            MCU last edited by

            @Mabbi
            ced728a0-05cf-477d-93e6-10f464291ae9-image.png
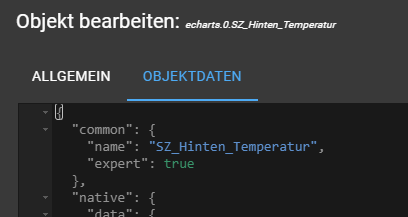
            Expertenmodus einschalten
            e6e3e402-d928-4859-b237-58fab0751030-image.png

            und dann die Objekt daten in Codetags
            f0aef7d4-e25b-4060-95d8-2e82f612e720-image.png

            1 Reply Last reply Reply Quote 0
            • M
              Mabbi last edited by

              @mcu: Ich bin mir nicht ganz sicher, was gemeint ist .... ?

              43439726-e34b-45fa-a8d9-2d29a2f2d648-grafik.png

              09cc9750-4cb8-48ab-a215-fb4e205b012f-grafik.png

              {
                "common": {
                  "read": true,
                  "write": true,
                  "name": "eCharts-DP",
                  "type": "string",
                  "role": "state",
                  "def": ""
                },
                "native": {},
                "type": "state",
                "from": "system.adapter.javascript.0",
                "user": "system.user.admin",
                "ts": 1755774987903,
                "_id": "0_userdata.0.echarts.echartsDP",
                "acl": {
                  "object": 1636,
                  "state": 1636,
                  "owner": "system.user.admin",
                  "ownerGroup": "system.group.administrator"
                }
              }
              
              M 1 Reply Last reply Reply Quote 0
              • M
                MCU @Mabbi last edited by

                @mabbi Sorry von energie, du woltest ja das erstmal nutzen
                9a3c0a95-9c4f-435c-8da9-156efc3c76e7-image.png

                M 1 Reply Last reply Reply Quote 0
                • M
                  Mabbi @MCU last edited by

                  @mcu

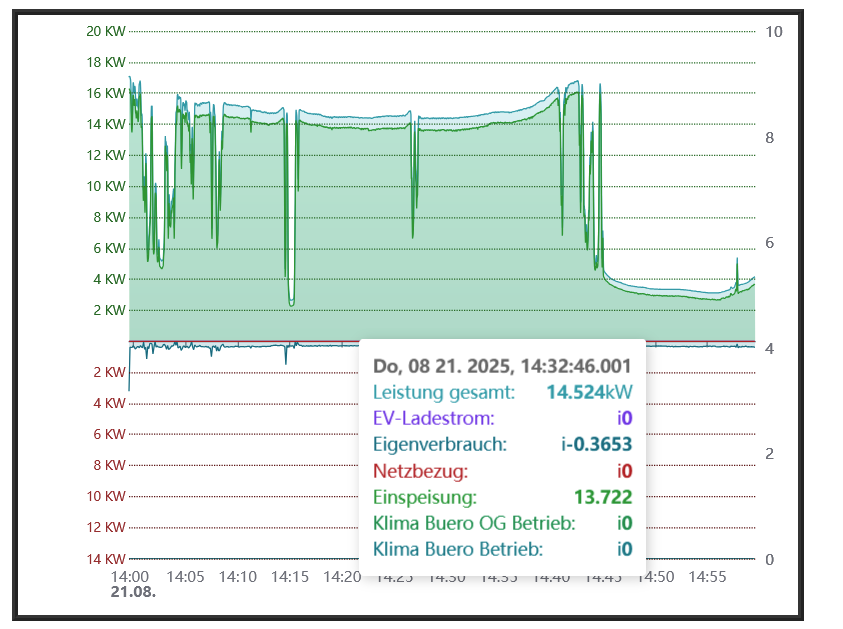
                  {
                    "common": {
                      "name": "D_Energie copy"
                    },
                    "native": {
                      "url": "",
                      "data": {
                        "lines": [
                          {
                            "name": "Leistung gesamt",
                            "id": "0_userdata.0.Datenpunkte.PV.Leistung_gesamt",
                            "instance": "system.adapter.sql.0",
                            "thickness": "1",
                            "chartType": "auto",
                            "aggregate": "max",
                            "isBoolean": null,
                            "symbolSize": 3,
                            "validTime": "",
                            "unit": "  kW",
                            "color": "#1a98a6",
                            "fill": 0.2,
                            "shadowsize": "",
                            "min": "-14",
                            "max": "20",
                            "ignoreNull": "0",
                            "noFuture": false,
                            "percentile": 50,
                            "integralUnit": 60,
                            "integralInterpolation": "none",
                            "yticks": "-1",
                            "xaxe": "",
                            "xticks": "6",
                            "yOffset": "0",
                            "points": false,
                            "hide": false,
                            "yaxe": "left",
                            "convert": "val / 1000",
                            "afterComma": "3"
                          },
                          {
                            "name": "EV-Ladestrom",
                            "id": "0_userdata.0.Datenpunkte.EV_Wallbox.EV-Ladestrom",
                            "instance": "system.adapter.history.0",
                            "thickness": "1",
                            "chartType": "auto",
                            "aggregate": "max",
                            "isBoolean": null,
                            "symbolSize": 3,
                            "validTime": "",
                            "fill": 0.2,
                            "min": "-8",
                            "max": "22",
                            "convert": "val / 1000 * -1",
                            "color": "#702ce6",
                            "xticks": "4",
                            "commonYAxis": "0",
                            "ignoreNull": "0"
                          },
                          {
                            "name": "Eigenverbrauch",
                            "id": "0_userdata.0.Datenpunkte.Strom.Eigenverbrauch",
                            "instance": "system.adapter.sql.0",
                            "thickness": "1",
                            "chartType": "auto",
                            "aggregate": "onchange",
                            "isBoolean": null,
                            "symbolSize": 3,
                            "validTime": 35,
                            "fill": 0.2,
                            "min": "-8",
                            "max": "22",
                            "convert": "val / 1000 * -1",
                            "color": "#00687d",
                            "xticks": "4",
                            "commonYAxis": "0",
                            "ignoreNull": "0"
                          },
                          {
                            "name": "Netzbezug",
                            "id": "0_userdata.0.Datenpunkte.Strom.Netzbezug",
                            "instance": "system.adapter.sql.0",
                            "thickness": "1",
                            "chartType": "auto",
                            "aggregate": "onchange",
                            "isBoolean": null,
                            "symbolSize": 3,
                            "validTime": 35,
                            "fill": 0.3,
                            "min": "-8",
                            "max": "22",
                            "convert": "val / 1000 * -1",
                            "color": "#b82124",
                            "xticks": "4",
                            "commonYAxis": "0",
                            "ignoreNull": "0",
                            "afterComma": ""
                          },
                          {
                            "name": "Einspeisung",
                            "id": "0_userdata.0.Datenpunkte.Strom.Einspeisung",
                            "instance": "system.adapter.sql.0",
                            "thickness": "1",
                            "chartType": "auto",
                            "aggregate": "onchange",
                            "isBoolean": null,
                            "symbolSize": 3,
                            "validTime": 35,
                            "fill": 0.2,
                            "min": "-8",
                            "max": "22",
                            "convert": "val / 1000",
                            "color": "#10952f",
                            "xticks": "4",
                            "commonYAxis": "0",
                            "ignoreNull": "0"
                          },
                          {
                            "name": "Klima Buero OG Betrieb",
                            "id": "0_userdata.0.Datenpunkte.Temperatur-Steuerung.Klima_Buero_OG_Betrieb",
                            "instance": "system.adapter.sql.0",
                            "thickness": "1",
                            "chartType": "line",
                            "aggregate": "minmax",
                            "isBoolean": null,
                            "symbolSize": 3,
                            "validTime": "",
                            "fill": 1,
                            "min": "0",
                            "max": "10",
                            "convert": "val * 0.25",
                            "color": "#008b47",
                            "xticks": "4",
                            "commonYAxis": "",
                            "ignoreNull": "false",
                            "yOffset": "0",
                            "percentile": 50,
                            "integralUnit": 60,
                            "integralInterpolation": "none"
                          },
                          {
                            "name": "Klima Buero Betrieb",
                            "id": "0_userdata.0.Datenpunkte.Temperatur-Steuerung.Klima_Buero_Betrieb",
                            "instance": "system.adapter.sql.0",
                            "thickness": "1",
                            "chartType": "line",
                            "aggregate": "minmax",
                            "isBoolean": null,
                            "symbolSize": 3,
                            "validTime": "",
                            "fill": 1,
                            "min": "0",
                            "max": "10",
                            "convert": "(val * 0.125)",
                            "color": "#007583",
                            "xticks": "4",
                            "commonYAxis": "",
                            "ignoreNull": "false",
                            "yOffset": "0"
                          }
                        ],
                        "marks": [
                          {
                            "color": "#5c1011",
                            "lineId": "0",
                            "upperValueOrId": "-2",
                            "lowerValueOrId": "",
                            "fill": 0,
                            "lineStyle": "dotted",
                            "text": "2 KW ",
                            "textSize": "10",
                            "textColor": "#9b2e2f"
                          },
                          {
                            "color": "#5c1011",
                            "lineId": "0",
                            "upperValueOrId": "-4",
                            "lowerValueOrId": "",
                            "fill": 0,
                            "lineStyle": "dotted",
                            "text": "4 KW ",
                            "textSize": "10",
                            "textColor": "#9b2e2f"
                          },
                          {
                            "color": "#5c1011",
                            "lineId": "0",
                            "upperValueOrId": "-6",
                            "lowerValueOrId": "",
                            "fill": 0,
                            "lineStyle": "dotted",
                            "text": "6 KW ",
                            "textSize": "10",
                            "textColor": "#9b2e2f"
                          },
                          {
                            "color": "#1d6923",
                            "lineId": "0",
                            "upperValueOrId": "2",
                            "lowerValueOrId": "",
                            "fill": 0,
                            "lineStyle": "dotted",
                            "text": "2 KW ",
                            "textSize": "10",
                            "textColor": "#1d6923"
                          },
                          {
                            "color": "#1d6923",
                            "lineId": "0",
                            "upperValueOrId": "4",
                            "lowerValueOrId": "",
                            "fill": 0,
                            "lineStyle": "dotted",
                            "text": "4 KW ",
                            "textSize": "10",
                            "textColor": "#1d6923"
                          },
                          {
                            "color": "#1d6923",
                            "lineId": "0",
                            "upperValueOrId": "6",
                            "lowerValueOrId": "",
                            "fill": 0,
                            "lineStyle": "dotted",
                            "text": "6 KW ",
                            "textSize": "10",
                            "textColor": "#1d6923"
                          },
                          {
                            "color": "#1d6923",
                            "lineId": "0",
                            "upperValueOrId": "8",
                            "lowerValueOrId": "",
                            "fill": 0,
                            "lineStyle": "dotted",
                            "text": "8 KW ",
                            "textSize": "10",
                            "textColor": "#1d6923"
                          },
                          {
                            "color": "#1d6923",
                            "lineId": "0",
                            "upperValueOrId": "10",
                            "lowerValueOrId": "",
                            "fill": 0,
                            "lineStyle": "dotted",
                            "text": "10 KW ",
                            "textSize": "10",
                            "textColor": "#1d6923"
                          },
                          {
                            "color": "#1d6923",
                            "lineId": "0",
                            "upperValueOrId": "12",
                            "lowerValueOrId": "",
                            "fill": 0,
                            "lineStyle": "dotted",
                            "text": "12 KW ",
                            "textSize": "10",
                            "textColor": "#1d6923"
                          },
                          {
                            "color": "#1d6923",
                            "lineId": "0",
                            "upperValueOrId": "14",
                            "lowerValueOrId": "",
                            "fill": 0,
                            "lineStyle": "dotted",
                            "text": "14 KW ",
                            "textSize": "10",
                            "textColor": "#1d6923"
                          },
                          {
                            "color": "#1d6923",
                            "lineId": "0",
                            "upperValueOrId": "16",
                            "lowerValueOrId": "",
                            "fill": 0,
                            "lineStyle": "dotted",
                            "text": "16 KW ",
                            "textSize": "10",
                            "textColor": "#1d6923"
                          },
                          {
                            "color": "#1d6923",
                            "lineId": "0",
                            "upperValueOrId": "18",
                            "lowerValueOrId": "",
                            "fill": 0,
                            "lineStyle": "dotted",
                            "text": "18 KW ",
                            "textSize": "10",
                            "textColor": "#1d6923"
                          },
                          {
                            "color": "#5c1011",
                            "lineId": "0",
                            "upperValueOrId": "-8",
                            "lowerValueOrId": "",
                            "fill": 0,
                            "lineStyle": "dotted",
                            "text": "8 KW ",
                            "textSize": "10",
                            "textColor": "#9b2e2f"
                          },
                          {
                            "color": "#5c1011",
                            "lineId": "0",
                            "upperValueOrId": "-10",
                            "lowerValueOrId": "",
                            "fill": 0,
                            "lineStyle": "dotted",
                            "text": "10 KW ",
                            "textSize": "10",
                            "textColor": "#9b2e2f"
                          },
                          {
                            "color": "#5c1011",
                            "lineId": "0",
                            "upperValueOrId": "-12",
                            "lowerValueOrId": "",
                            "fill": 0,
                            "lineStyle": "dotted",
                            "text": "12 KW ",
                            "textSize": "10",
                            "textColor": "#9b2e2f"
                          },
                          {
                            "color": "#5c1011",
                            "lineId": "0",
                            "upperValueOrId": "-14",
                            "lowerValueOrId": "",
                            "fill": 0,
                            "lineStyle": "dotted",
                            "text": "14 KW ",
                            "textSize": "10",
                            "textColor": "#9b2e2f"
                          },
                          {
                            "color": "#1d6923",
                            "lineId": "0",
                            "upperValueOrId": "20",
                            "lowerValueOrId": "",
                            "fill": 0,
                            "lineStyle": "dotted",
                            "text": "20 KW ",
                            "textSize": "10",
                            "textColor": "#1d6923"
                          }
                        ],
                        "timeType": "relative",
                        "relativeEnd": "now",
                        "range": "1440",
                        "aggregateType": "step",
                        "aggregateSpan": "1",
                        "legend": "",
                        "hoverDetail": true,
                        "zoom": true,
                        "animation": 0,
                        "live": "300",
                        "ticks": "",
                        "width": "",
                        "height": "",
                        "noBorder": "",
                        "window_bg": "#000000",
                        "bg_custom": "",
                        "x_labels_color": "",
                        "y_labels_color": "",
                        "border_color": "#343434",
                        "grid_color": "",
                        "grid_hideX": true,
                        "grid_hideY": true,
                        "border_width": "5",
                        "barColor": "",
                        "barLabels": "topover",
                        "barWidth": "",
                        "barFontSize": "",
                        "barFontColor": "",
                        "title": "",
                        "titlePos": "",
                        "titleColor": "",
                        "titleSize": "",
                        "legColumns": "",
                        "legBgOpacity": "",
                        "legBg": "",
                        "timeFormat": "",
                        "export": false,
                        "legendDirection": "",
                        "useComma": false,
                        "noBackground": true,
                        "legActual": false,
                        "legFontSize": "",
                        "legendHeight": "",
                        "resetZoom": "600",
                        "autoGridPadding": false,
                        "theme": "default",
                        "hoverNoInterpolate": false,
                        "hoverNoNulls": false,
                        "timeFormatCustom": false,
                        "border_style": "ridge",
                        "border_padding": "5"
                      }
                    },
                    "type": "chart",
                    "_id": "echarts.0.D_Energie_copy",
                    "acl": {
                      "object": 1636,
                      "owner": "system.user.admin",
                      "ownerGroup": "system.group.administrator"
                    },
                    "from": "system.adapter.admin.0",
                    "user": "system.user.admin",
                    "ts": 1755630349601
                  }
                  
                  M 1 Reply Last reply Reply Quote 0
                  • M
                    MCU @Mabbi last edited by MCU

                    @mabbi ok

                    • Jetzt erstmal unter 0_userdata das Verzeichnis 0_userdata.0.echarts löschen.
                    • dann Verzeichnis für echartDP im Programm wieder auf Standard zurücksetzen und Programm speichern -> DPs werden wieder angelegt
                    let echartDP                = '0_userdata.0.echarts';
                    
                    • Im Verzeichnis 0_userdata.0.echarts gibt es nun den DP echartsDP, da kommt nun Dein echarts.0.D_Energie_copyals Wert eingetragen.

                    dde2158e-9920-4fcd-ae13-ea704c9df5ef-image.png

                    M mickemup 2 Replies Last reply Reply Quote 0
                    • M
                      Mabbi @MCU last edited by

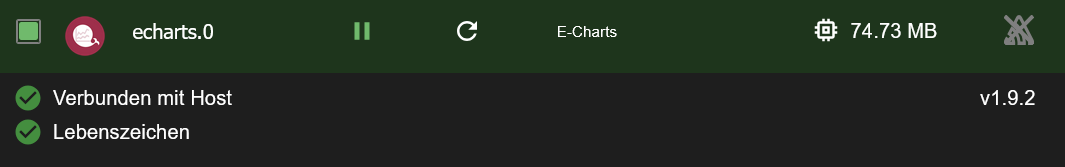
                      @mcu Cool, jetzt gehts.

                      efabe78b-fa01-4422-aad2-ea024b722851-grafik.png

                      Mein Fehler war die Änderung des javascripts, dadurch wurden die 0_userdata.0.echarts mehrfach angelegt.
                      Hatte mich schon gewundert, warum die 2x vorhanden waren.

                      Vielen Dank für Deine Hilfe.

                      1 Reply Last reply Reply Quote 0
                      • mickemup
                        mickemup @MCU last edited by

                        @mcu

                        Salü

                        Ich habe versucht mit folgenden Skript zu arbeiten:
                        Widgets aus- / einblenden
                        Scripts "widgetsDisplay.js" kopieren und in Scripts (jarvis) einfügen.

                        was eigentlich auch funktioniert hat.

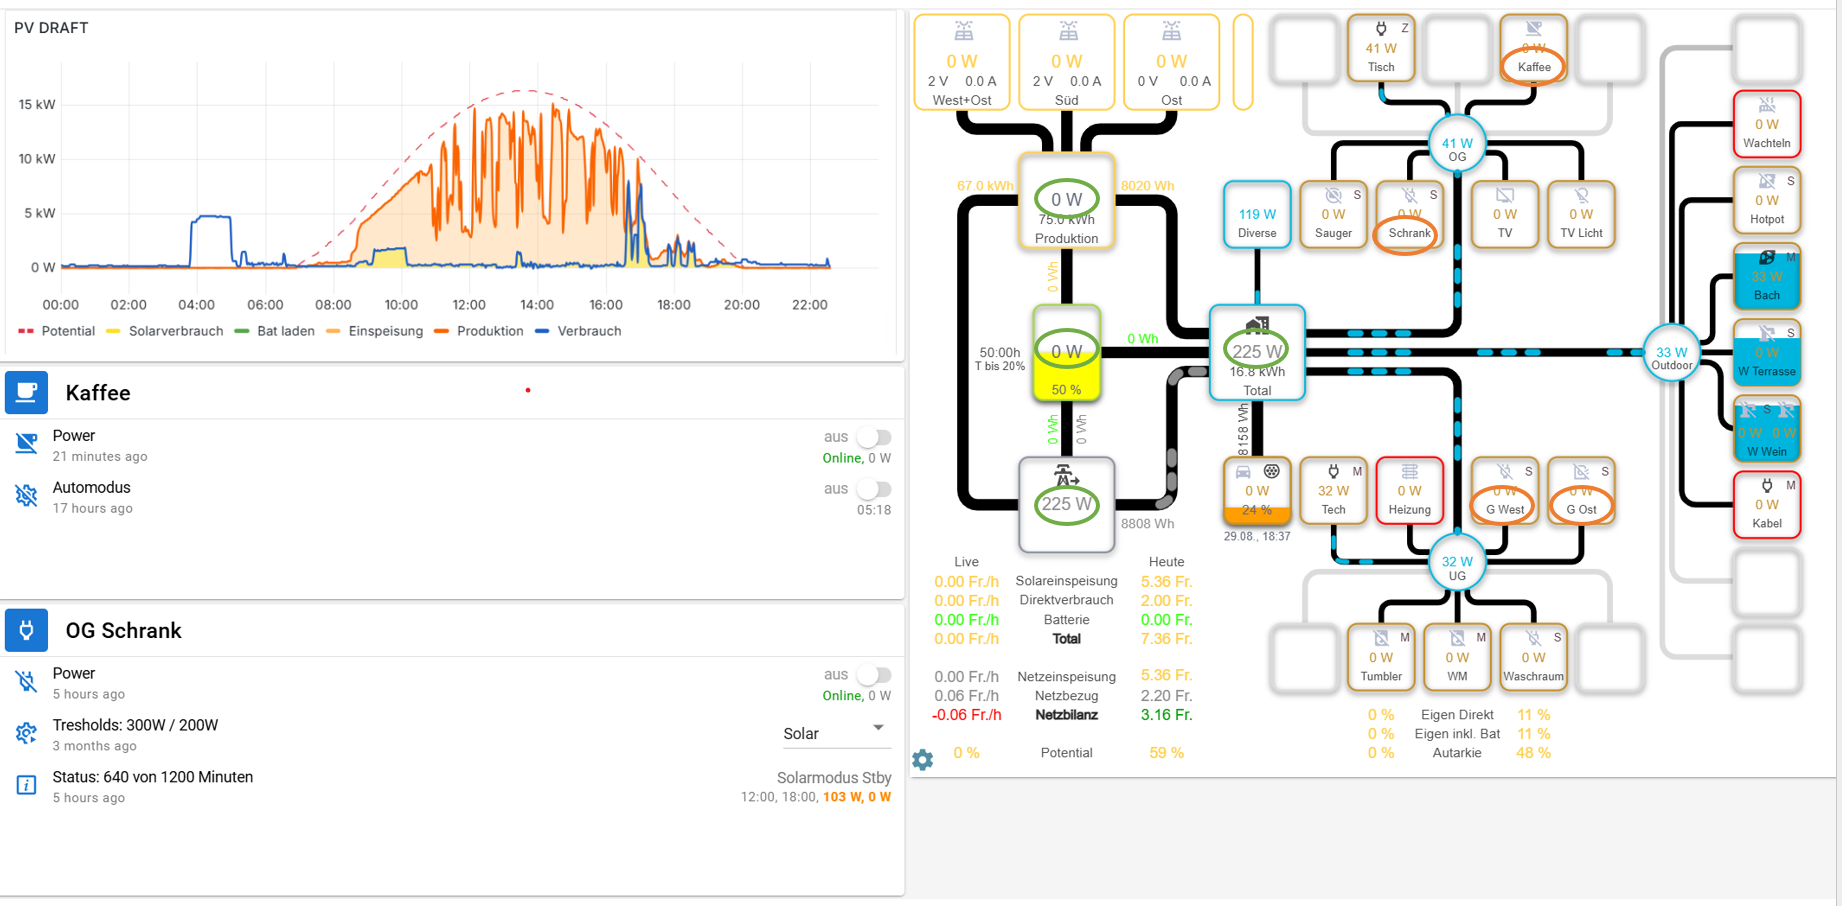
                        Meine Idee ist mittels Selektion (klick auf Objekt im Eflussadapter) links unten dann das entsprechende Widget einzublenden (und die anderen auszublenden).
                        Dies kriege ich auch hin, allerdings würde ich die alle gerne am "gleichen" Ort haben und nicht ein Lücke haben dort wo das ausgeblendete ist:

                        b9fe815f-3fed-4983-9ee1-727367eb67cd-image.png

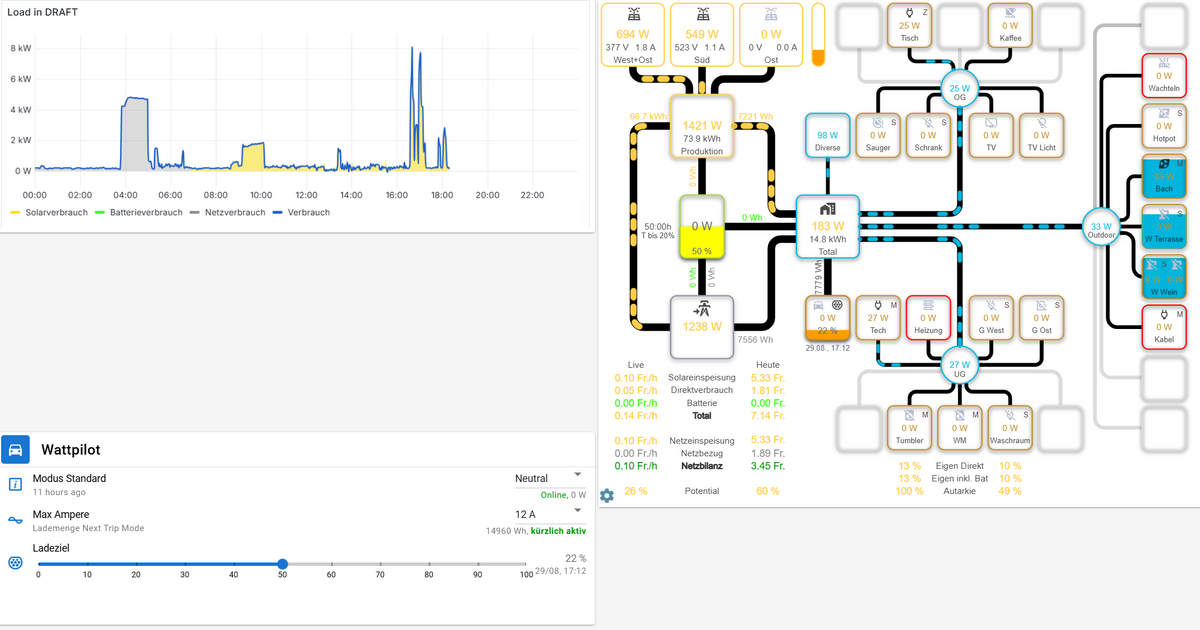
                        Ist das irgendwie möglich?

                        Alternativ-Elegant wäre natürlich auch, wenn man bei "Assign Widget to Box" die ID "relativ" setzen könnte z.B zu einem eigenen DP, dann bleibt die Position natürlich 🙂 .

                        Grüsse

                        Jarvis V3.1.8

                        M 1 Reply Last reply Reply Quote 0
                        • M
                          MCU @mickemup last edited by

                          @mickemup
                          Bin noch dabei
                          https://mcuiobroker.gitbook.io/jarvis-infos/jarvis-v3/besonderheiten-v3/scripts-3.2.x-pro/widgets/widgetshiding

                          Die "Alternative" schau ich mir auch mal an.

                          mickemup 1 Reply Last reply Reply Quote 1
                          • mickemup
                            mickemup @MCU last edited by

                            @mcu
                            Super Danke.

                            Für meinen Fall wäre die Alternative wohl fast einfacher (für mich) dann muss ich nur einen Werte ändern.
                            Ansonsten muss ich immer eins: einschalten und das alte ausschalten.

                            Analog mache ich dies bei mir schon mit StateHTML, wo der jeweilige "Grafana-Iframe" in einem DP steht, welcher dann angepasst wird.

                            M 1 Reply Last reply Reply Quote 0
                            • M
                              MCU @mickemup last edited by

                              @mickemup In Deinem Fall müsste man die Ordernumber von diesem Widget ändern, richtig?.
                              3d6e0f61-1b6f-475f-86af-d1801ec0f643-image.png

                              mickemup 1 Reply Last reply Reply Quote 0
                              • mickemup
                                mickemup @MCU last edited by

                                @mcu

                                Genau: das Widget oberhalb ist ausgeblendet und das von dir gezeigte sollte eigentlich dann dort sein.

                                Ich hätte wohl am Ende so um die 10 Widgets, aber will nur immer 1 zeigen am selben Ort.

                                M 1 Reply Last reply Reply Quote 0
                                • M
                                  MCU @mickemup last edited by

                                  @mickemup Sind diese 10 alle eCharts als iFrame?

                                  mickemup 1 Reply Last reply Reply Quote 0
                                  • mickemup
                                    mickemup @MCU last edited by

                                    @mcu
                                    Also oben links habe ich es so StateHTML gelöst.
                                    Diese verweisen auf einen Datenpunkt und dort drin passe ich bei einem Klick z.B auf die Produktionsleistung den DP vom StateHTML an:

                                    <iframe src="http://192.168.1.203:3000/d-solo/b3395744-04be-4f4d-83ca-358dd5afe53b/energie-live?orgId=1&refresh=30s&theme=light&panelId=27&__feature.dashboardSceneSolo=false" width="100%"  height="325"  frameborder="0"></iframe>


                                    Wenn ich analog die ID in "Assign Widget to Box" Widget ID anpassen könnte, wäre es für mich ideal:
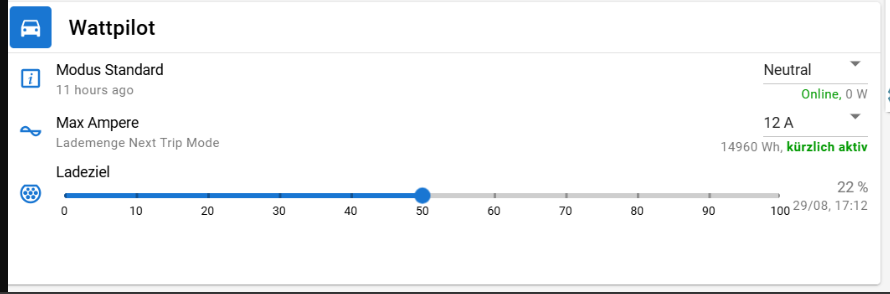
                                    Unten links sind alles "State Lists" die ich gerne anzeigen würde:

                                    cd27e808-ce57-4de3-857a-da1afdc32d8a-image.png

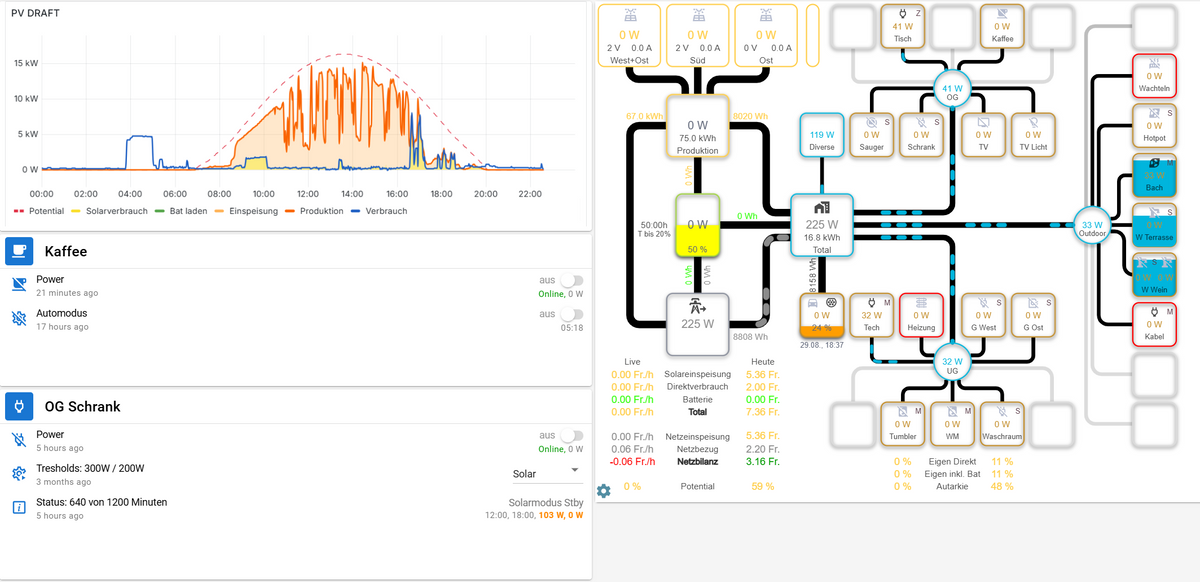
                                    Also Anstatt die beiden (oder eben am Ende ca. 10) soll dort nur ein Widget (State List) dargestellt werden.

                                    M 1 Reply Last reply Reply Quote 0
                                    • M
                                      MCU @mickemup last edited by

                                      @mickemup Grafana?

                                      mickemup 1 Reply Last reply Reply Quote 0
                                      • mickemup
                                        mickemup @MCU last edited by mickemup

                                        @mcu Oben links kann ich meine Grafana-Plots durchswitchen ja.

                                        Unten Links würde ich das gleiche gerne mit "StateLists" machen.
                                        Ober eben halt nur die ausgewählte/rechts angeklickte anzeigen.

                                        M 1 Reply Last reply Reply Quote 0
                                        • M
                                          MCU @mickemup last edited by

                                          @mickemup Also jede "Kurve" hat dazu eine eigene StateList, die dann, direkt darunter, angezeigt werden soll?

                                          1 Reply Last reply Reply Quote 0
                                          • mickemup
                                            mickemup last edited by

                                            @mcu
                                            Sry nein das ist unabhängig.

                                            Mit Klicks auf die grün markiertern Leistungswerte Toggle ich oben links durch die Grafiken.
                                            Das funktioniert bereits 1A.

                                            Mit Klicks auf die orange markierten Kreise (werden evtl. noch mehr) würde ich gerne durch StateLists "togglen" welche dann unten Links stehen sollen.
                                            Ich hoff ,ich konnte mich verständlich ausdrücken.

                                            33eb94c0-8737-402f-b961-24f6b54d9610-image.png

                                            M 1 Reply Last reply Reply Quote 0
                                            • First post
                                              Last post

                                            Support us

                                            ioBroker
                                            Community Adapters
                                            Donate

                                            813
                                            Online

                                            32.0k
                                            Users

                                            80.5k
                                            Topics

                                            1.3m
                                            Posts

                                            javascript
                                            33
                                            883
                                            191443
                                            Loading More Posts
                                            • Oldest to Newest
                                            • Newest to Oldest
                                            • Most Votes
                                            Reply
                                            • Reply as topic
                                            Log in to reply
                                            Community
                                            Impressum | Datenschutz-Bestimmungen | Nutzungsbedingungen
                                            The ioBroker Community 2014-2023
                                            logo