Grafana Tagesverbrauch
-
@Negalein hast du es mal unabhängig von Sourceanalytics so eingestellt?
-
@Negalein ich nehme den Wert aus meinem Pulscounter, also den Gesamtzählerwert, den Rest macht ja Grafana.
du hast jaIch hab 2 DP zur Verfügung: hs100.0.10_0_1_80.power = der aktuelle Verbrauch hs100.0.10_0_1_80.totalNow = der Tagesverbrauch -
@Malaus sagte in Grafana Tagesverbrauch:
hast du es mal unabhängig von Sourceanalytics so eingestellt?
Du hast für jeden Tag der Woche einen eigenen Query?
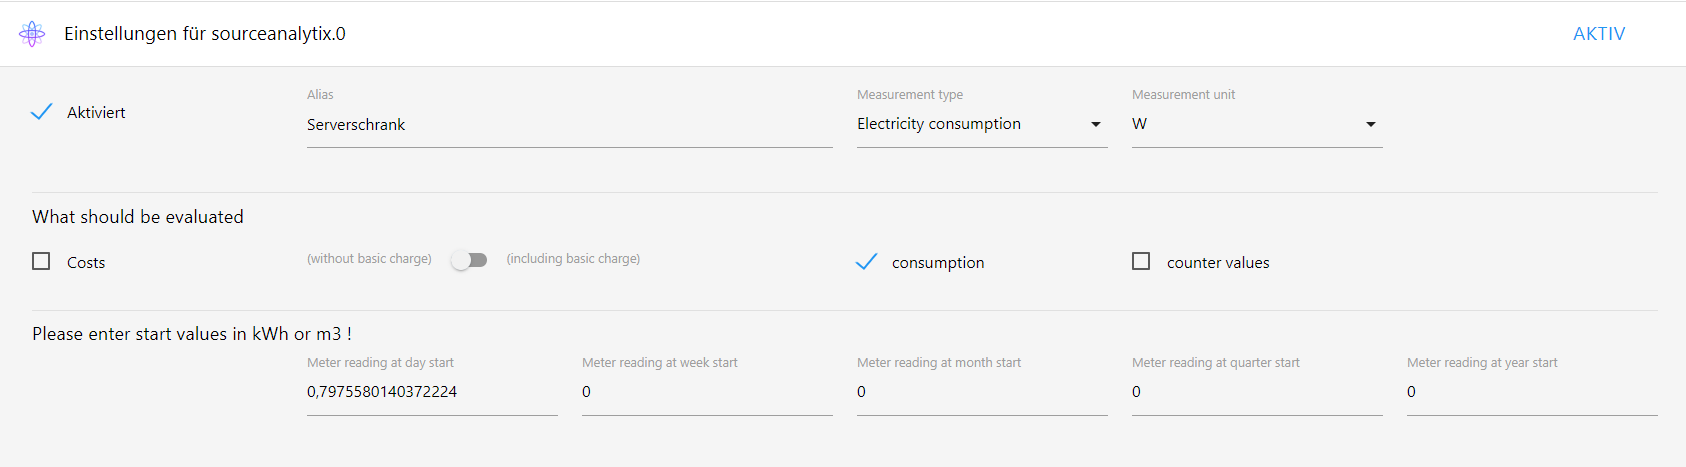
Das geht dann nur mit Sourceanalytics.In Source hab ich den DP so eingestellt.
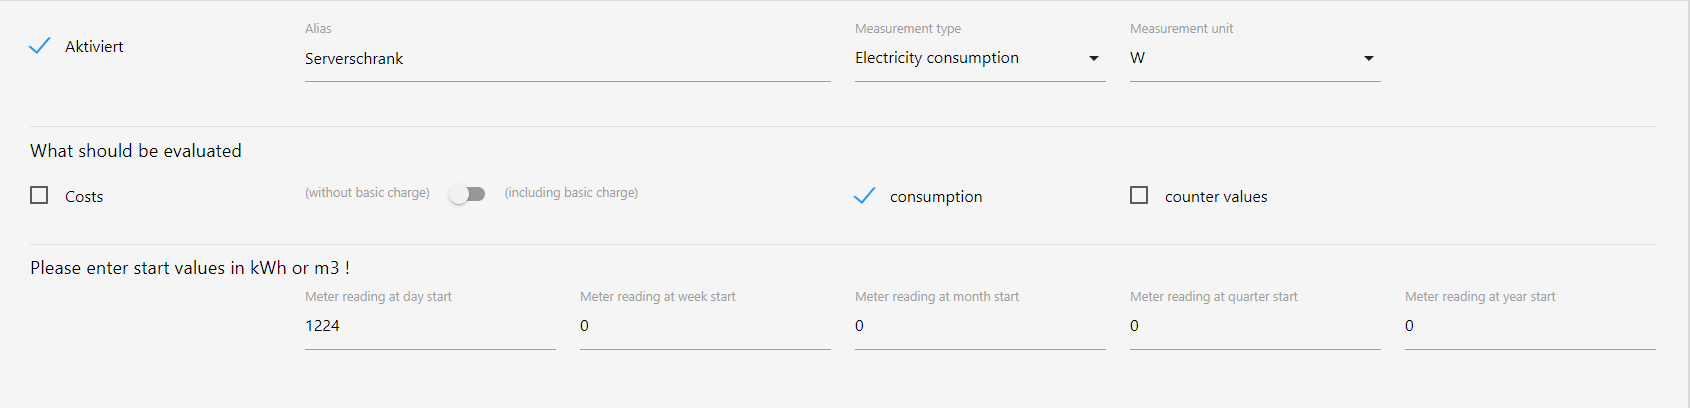
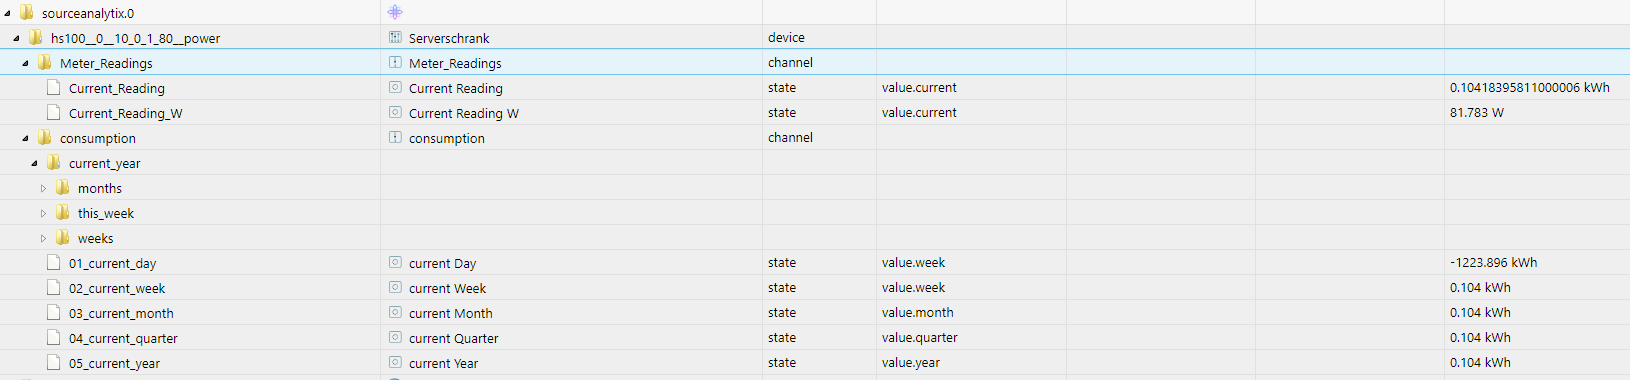
Meter reading at day starthab ich den Wert vom DP übernommen, zu dem Zeitpunkt als ich Source aktiviert habe.DP in den Objekten bei Source schaut so aus.
Zu sehen der Minus-Wert.
-
@crunchip sagte in Grafana Tagesverbrauch:
ich nehme den Wert aus meinem Pulscounter, also den Gesamtzählerwert, den Rest macht ja Grafana.
Monatsverbrauch hätt ich noch als DP dieser Dose.
Wird aber auch nicht viel bringen? -
@Negalein trag deinen Wert überall ein, kommende Woche passt sich dann der Wert Woche automatisch an, zum Monatsanfang passt sich dann der Wert Monat automatisch an usw...
das "Umwandeln "Watt" in "kWh" ...gab´s Probleme soviel ich weiss, keine Ahnung ob das schon 100% funktioniert -
@crunchip sagte in Grafana Tagesverbrauch:
trag deinen Wert überall ein, kommende Woche passt sich dann der Wert Woche automatisch an, zum Monatsanfang passt sich dann der Wert Monat automatisch an usw...
Ok, danke.
Hab einen Fehler gesehen. Muss ja nicht 1224 sondern 1.224 eintragen.Und der Tageswert kommt jetzt von Tag zu Tag dazu.
-
@crunchip sagte in Grafana Tagesverbrauch:
trag deinen Wert überall ein
Gerade noch gesehen, dass ich bei zB
Meter reading at week startden Wert ja nicht weiß. -
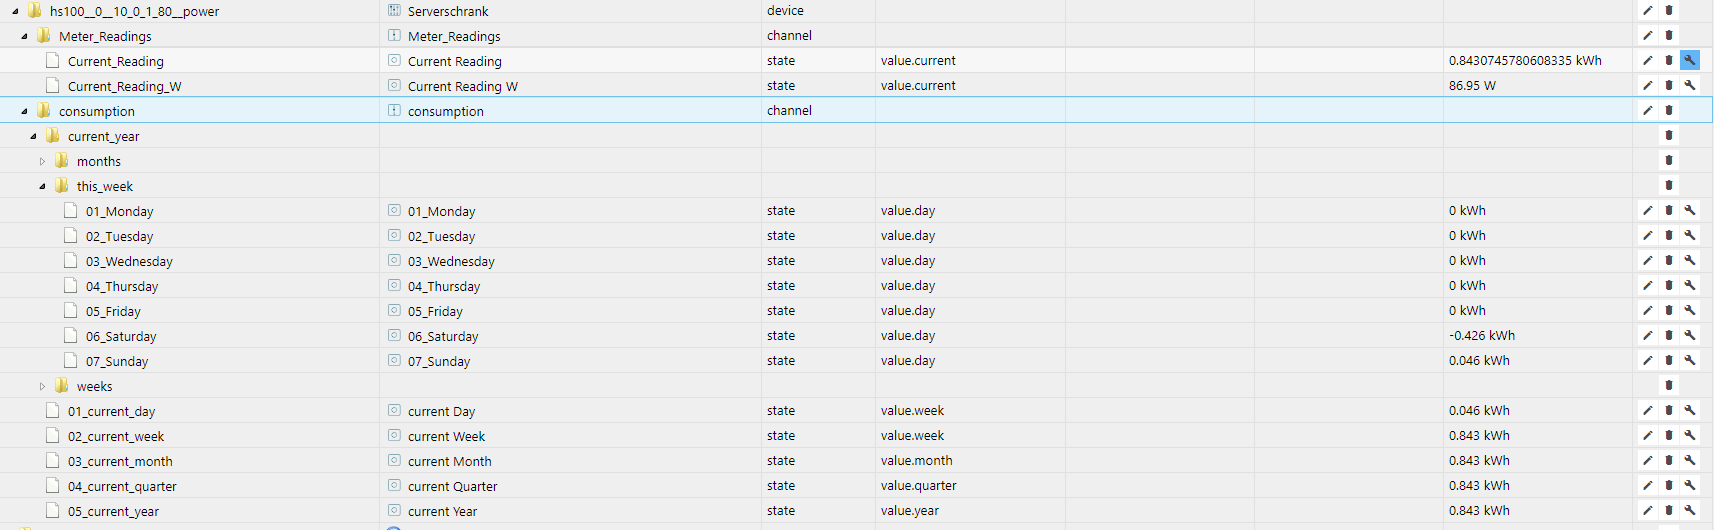
@Negalein
sourceanalytix.0.xyz.Meter_Readings.current_year.this_weeksiehst du deinen fortlaufenden Verbrauch
sourceanalytix.0.xyz.consumption.current_year.this_weekdeinen täglichen Verbrauch -
@Negalein musst du ja nicht, du startest mit dem jetzigen Wert, ab Montag startet die Berechnung für die neue Woche automatisch
-
@Negalein du müsstest dann
sourceanalytix.0.xyz.Meter_Readings.Current_Readingfür deinen Grafana Datenpunkt nehmen -
@crunchip sagte in Grafana Tagesverbrauch:
musst du ja nicht, du startest mit dem jetzigen Wert, ab Montag startet die Berechnung für die neue Woche automatisch
Ok, ich dachte du meinst ich muss den Wert überall eintragen.
@crunchip sagte in Grafana Tagesverbrauch:
du müsstest dann sourceanalytix.0.xyz.Meter_Readings.Current_Reading für deinen Grafana Datenpunkt nehmen
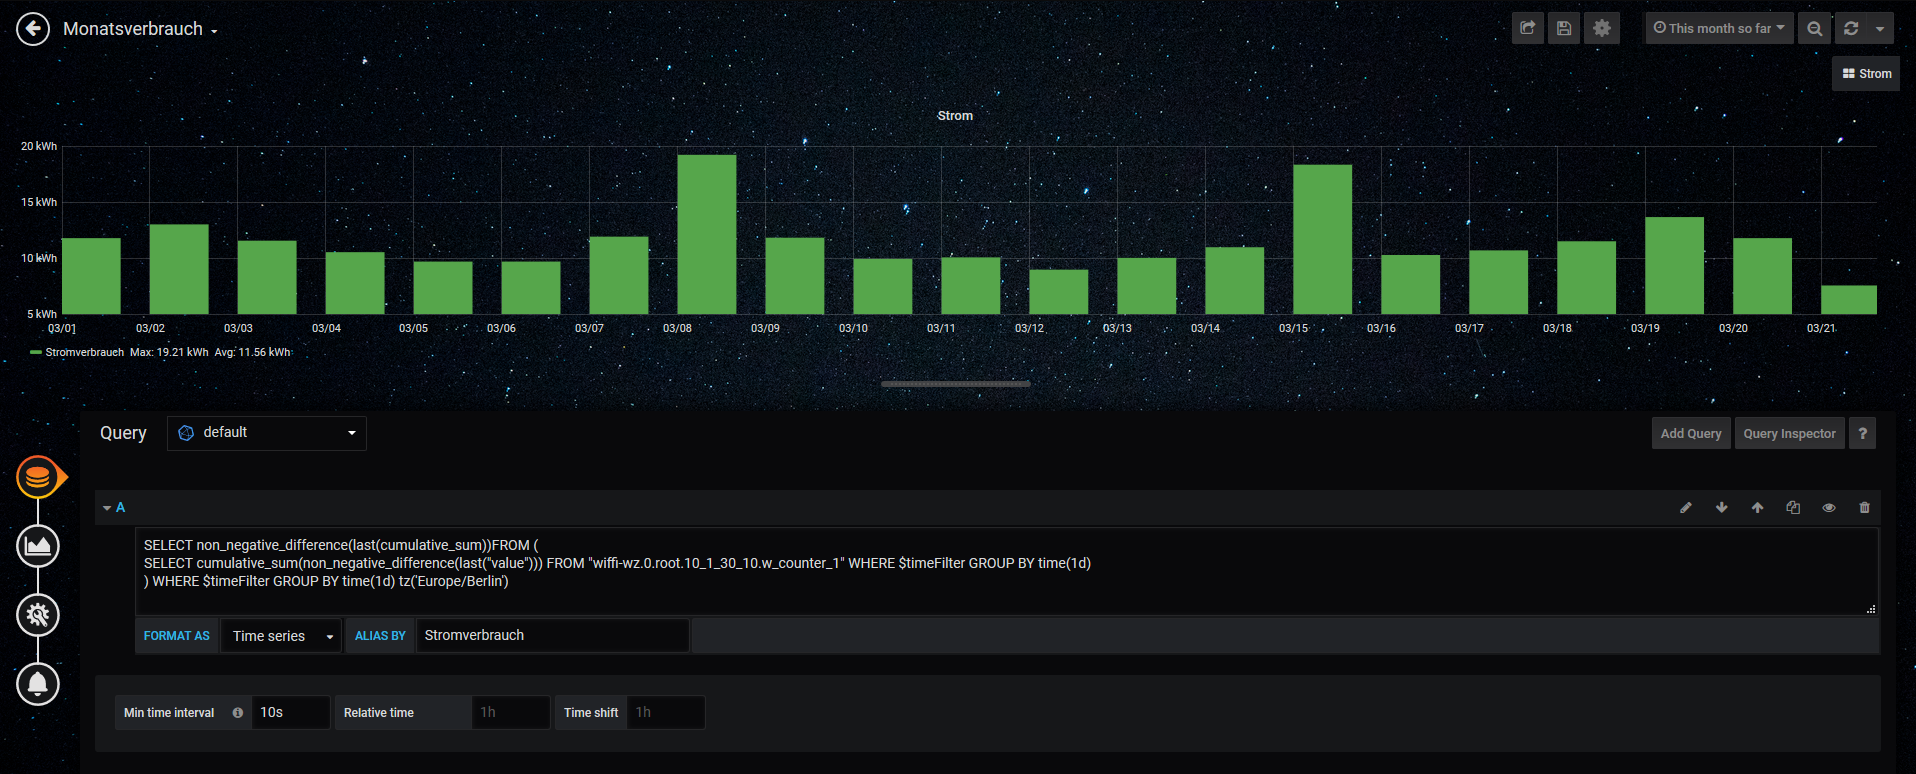
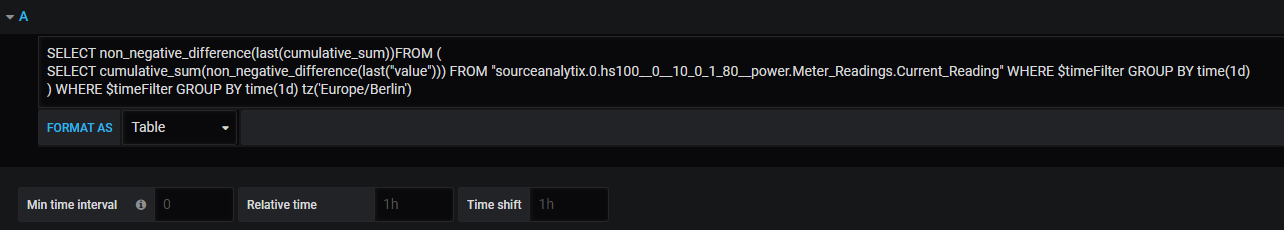
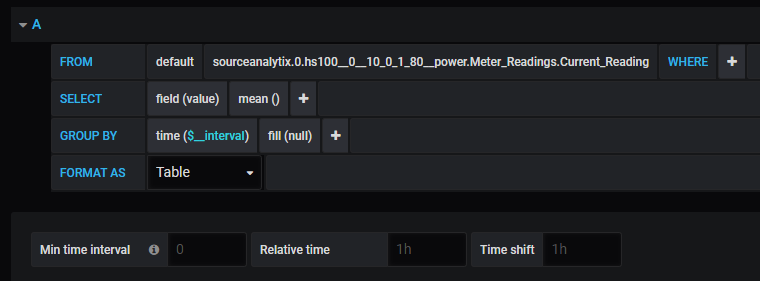
Und so die Formel dann verwenden?
SELECT non_negative_difference(last(cumulative_sum))FROM ( SELECT cumulative_sum(non_negative_difference(last("value"))) FROM "sourceanalytix.0.hs100__0__10_0_1_80__power.Meter_Readings.Current_Reading" WHERE $timeFilter GROUP BY time(1d) ) WHERE $timeFilter GROUP BY time(1d) tz('Europe/Berlin')Dann bekomm ich für jeden Tag einen eigenen Balken?
-
@Negalein sagte in Grafana Tagesverbrauch:
Dann bekomm ich für jeden Tag einen eigenen Balken
ja
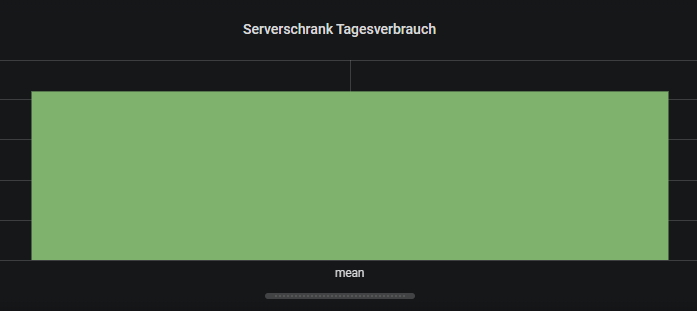
hier ein Beispiel,
jeden Tag kommt ein Balken dazu...am Monatsanfang beginnt es wieder mit einem Balken
-
-
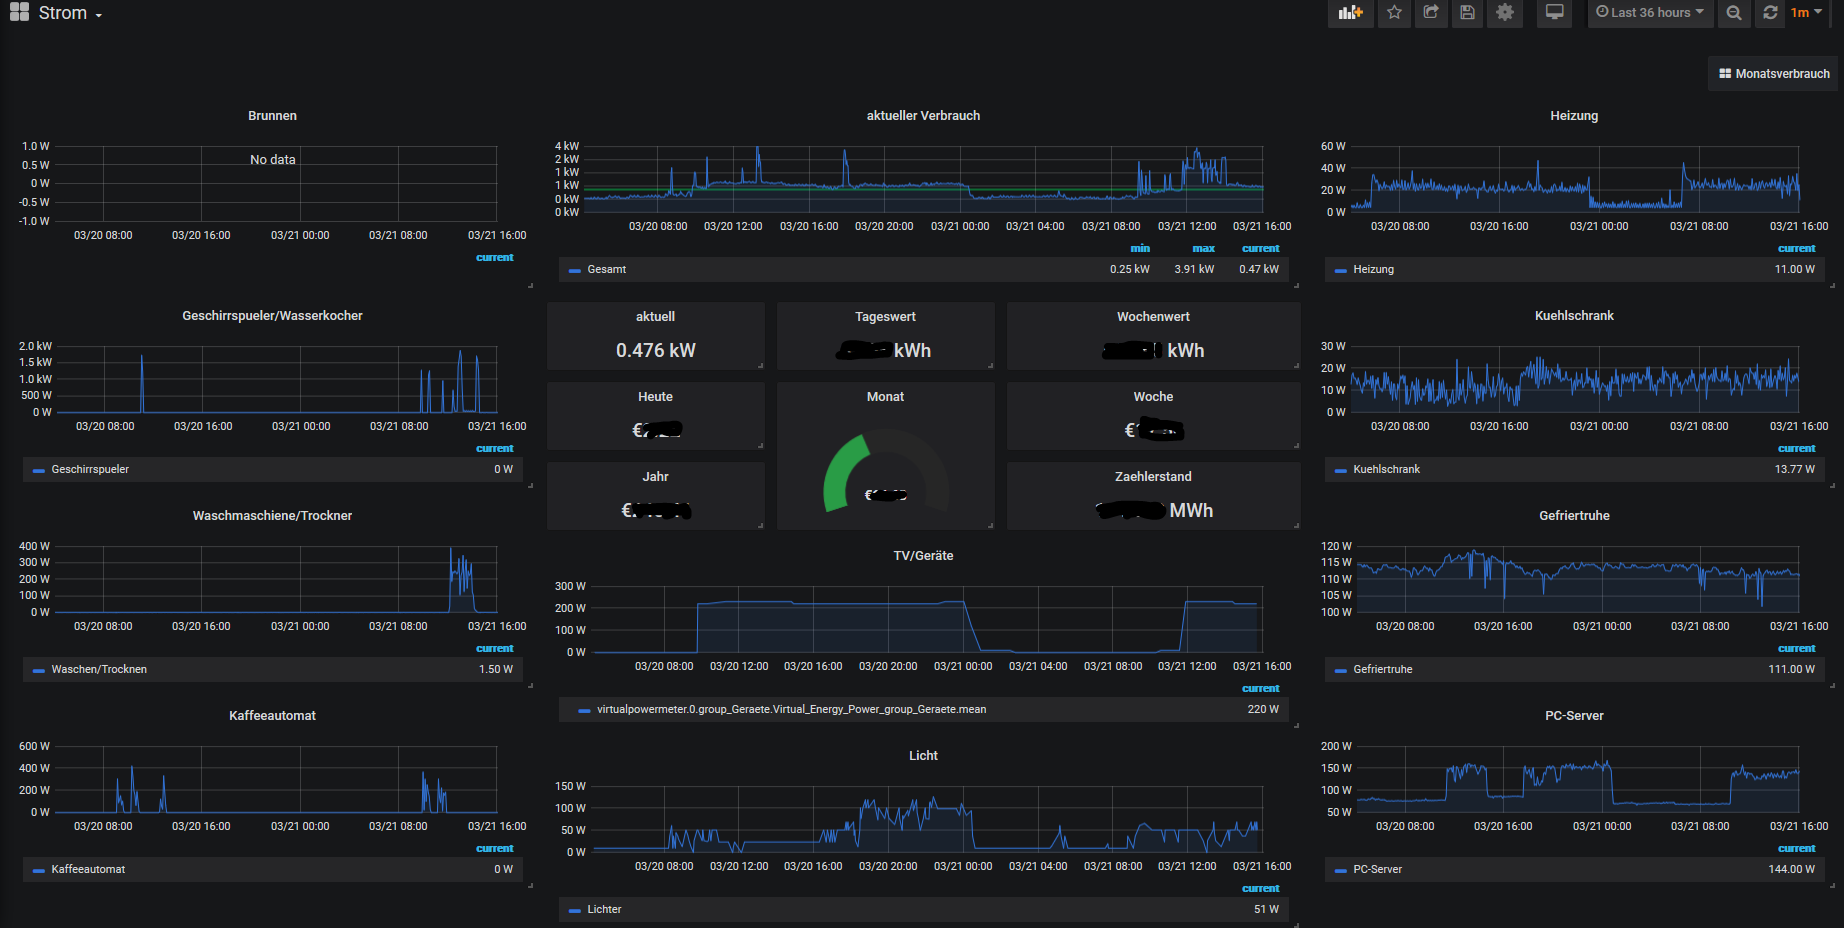
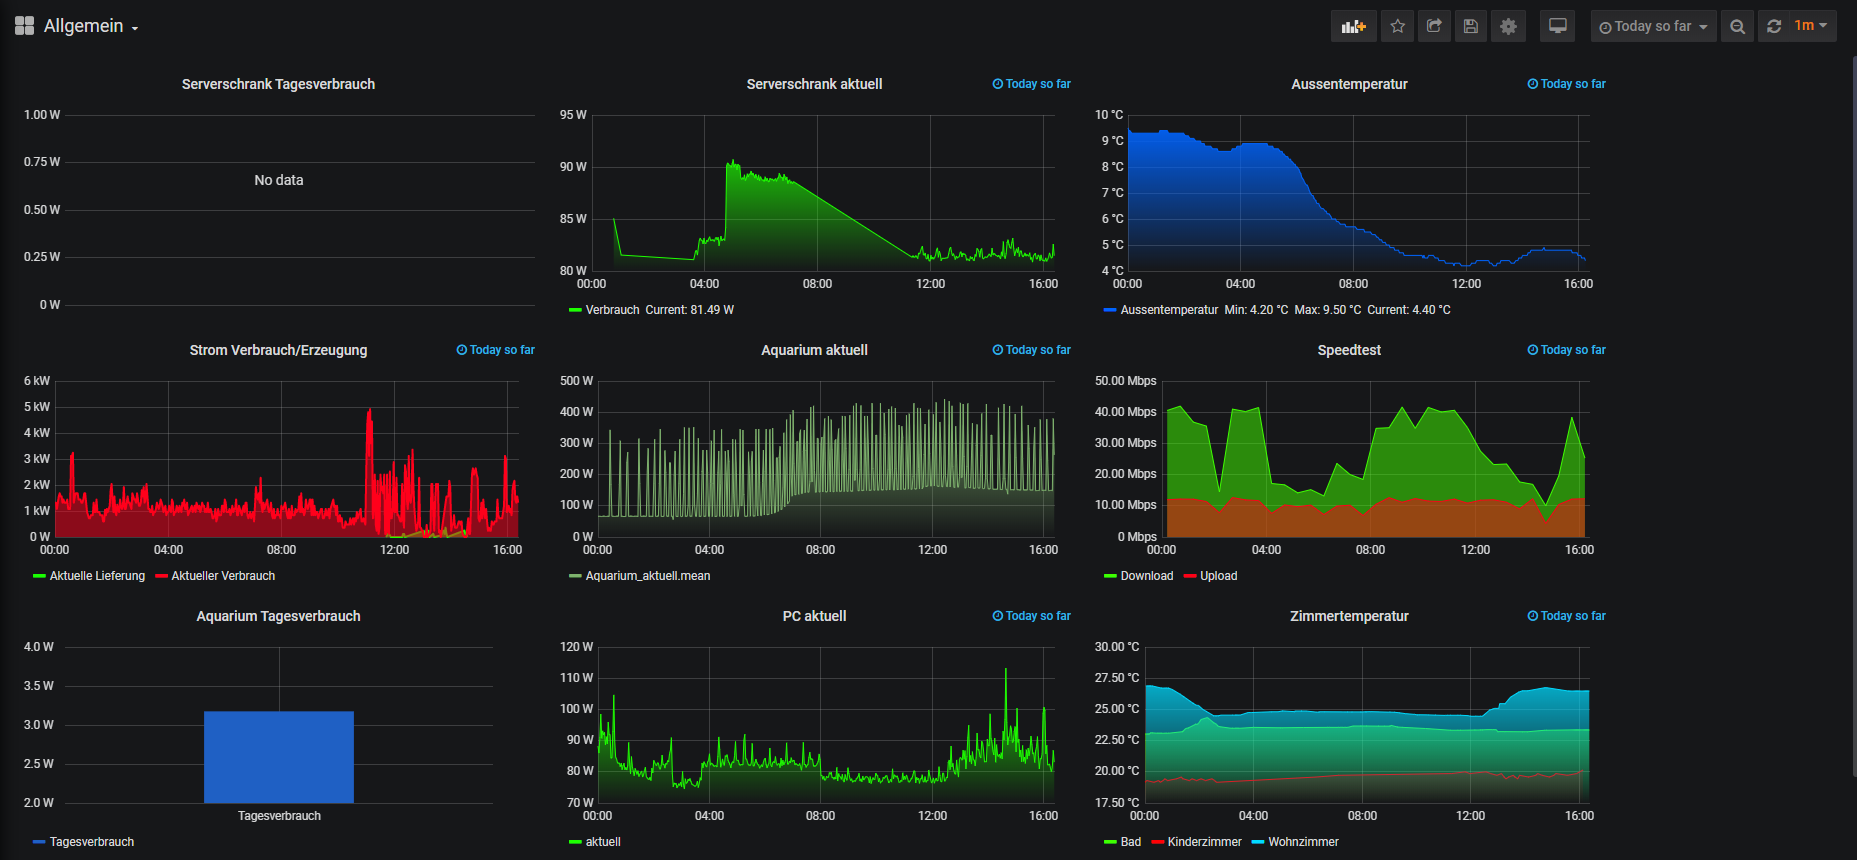
@Negalein einzelne Geräte oder auch über sourceanalytix kannst du dann so einstellen
Beispiel
-
@crunchip sagte in Grafana Tagesverbrauch:
einzelne Geräte oder auch über sourceanalytix kannst du dann so einstellen
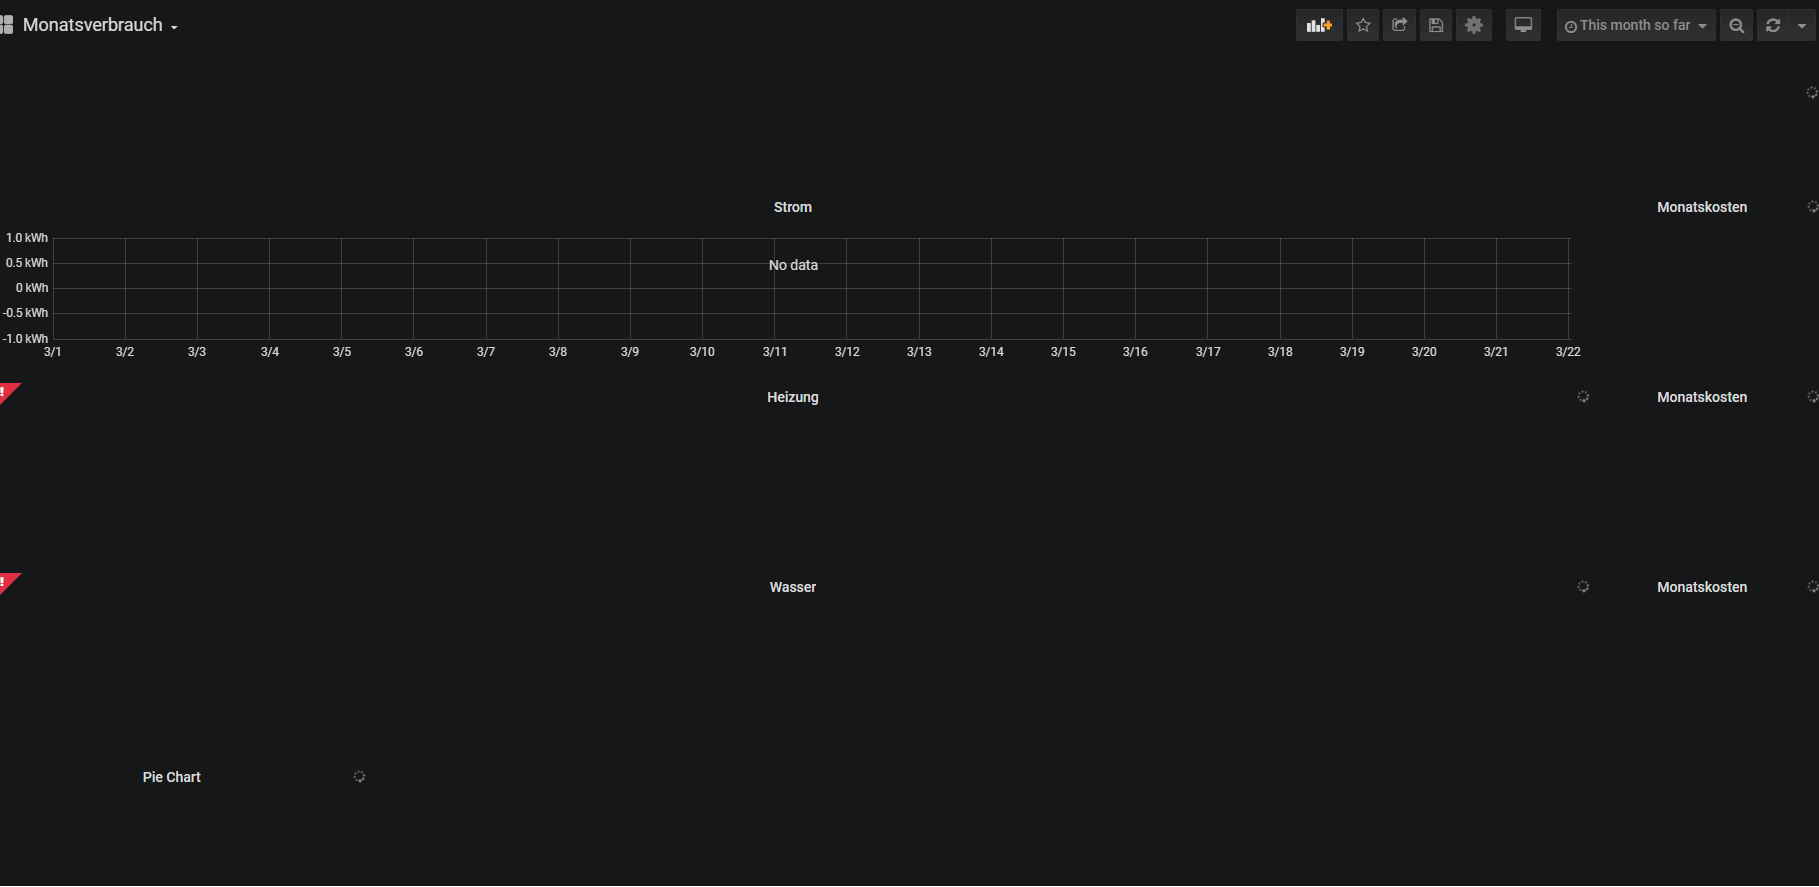
so schaut derzeit mein Dashboard aus
-
Kannst du nochmal schauen?
Diese DP werden jetzt befüllt.
Seit Mitternacht auch im positiven Bereich für Sonntag.
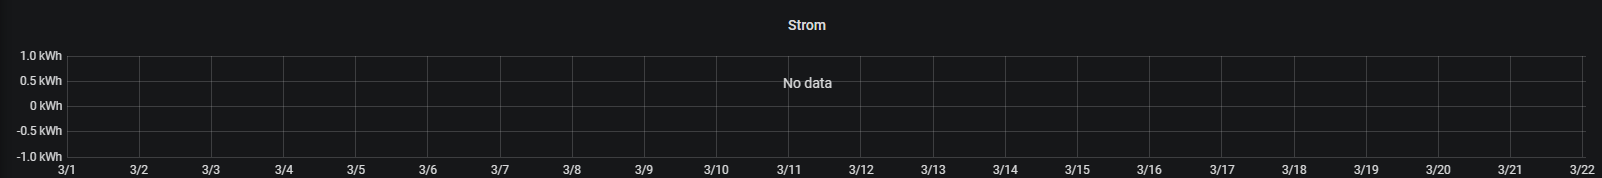
In Grafana hab ich es so eingetragen.
Trotzdem steht "no Data".
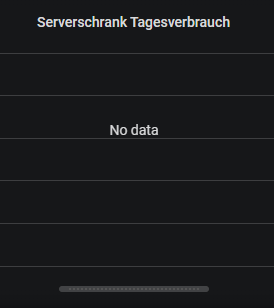
Trag ich als Query direkt den DP ein, kommt ein Balken.
Was mach ich da falsch?
Danke
-
@Negalein bist du sicher das die Bezeichnung richtig geschrieben ist? kommt mir irgendwie etwas komisch vor mit dem...hs100__0__10....(die doppelten unterstriche)
-
@crunchip sagte in Grafana Tagesverbrauch:
bist du sicher das die Bezeichnung richtig geschrieben ist? kommt mir irgendwie etwas komisch vor mit dem...hs100__0__10....(die doppelten unterstriche)
Ja, gerade nochmal geschaut.
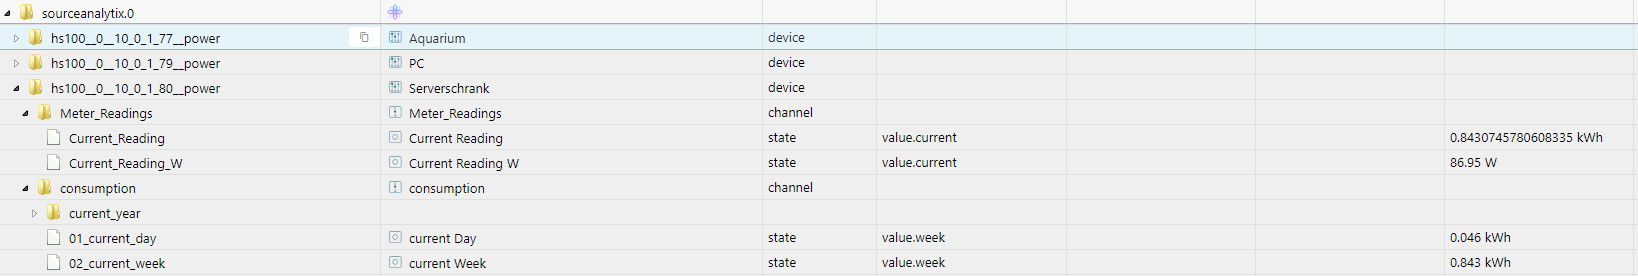
So siehts in Source aus:
Und so die DP:
zB dersourceanalytix.0.hs100__0__10_0_1_80__power.Meter_Readings.Current_Reading
-
@Negalein mach mal ein neues dasboard füge die json ein...und natürlich deinen Datenpunkt anpassen
-
@crunchip sagte in Grafana Tagesverbrauch:
mach mal ein neues dasboard füge die json ein...und natürlich deinen Datenpunkt anpassen
kommt auch "no Data"
")
