SOLVED [gelöst] admin Seiten laden extrem langsam bis gar nicht
-
Nach reboot ist es an sich das gleiche.
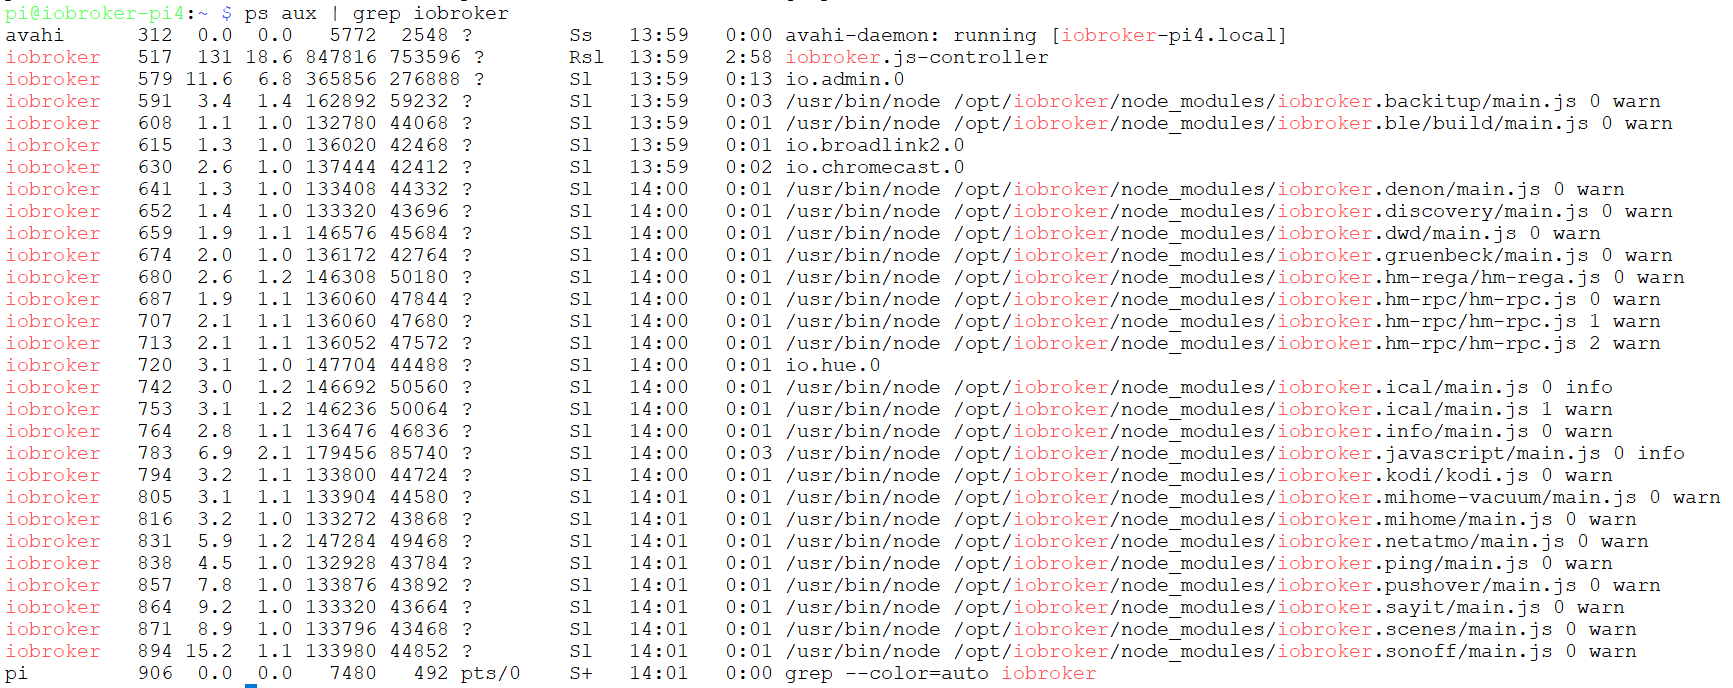
Es sind aber auch nicht wirklich 4 Prozesse, htop zeigt glaube ich jeden Prozess pro CPU Kern?
Jedenfalls bei "ps" ist es nur ein Prozess:
Glaube nicht, dass 1,25MB der freie Swap ist, sondern der belegte von 100MB. Nach reboot ist dieser wie erwartet auf 0. Hier ein neuer Screenshot während admin im Browser geladen wird:
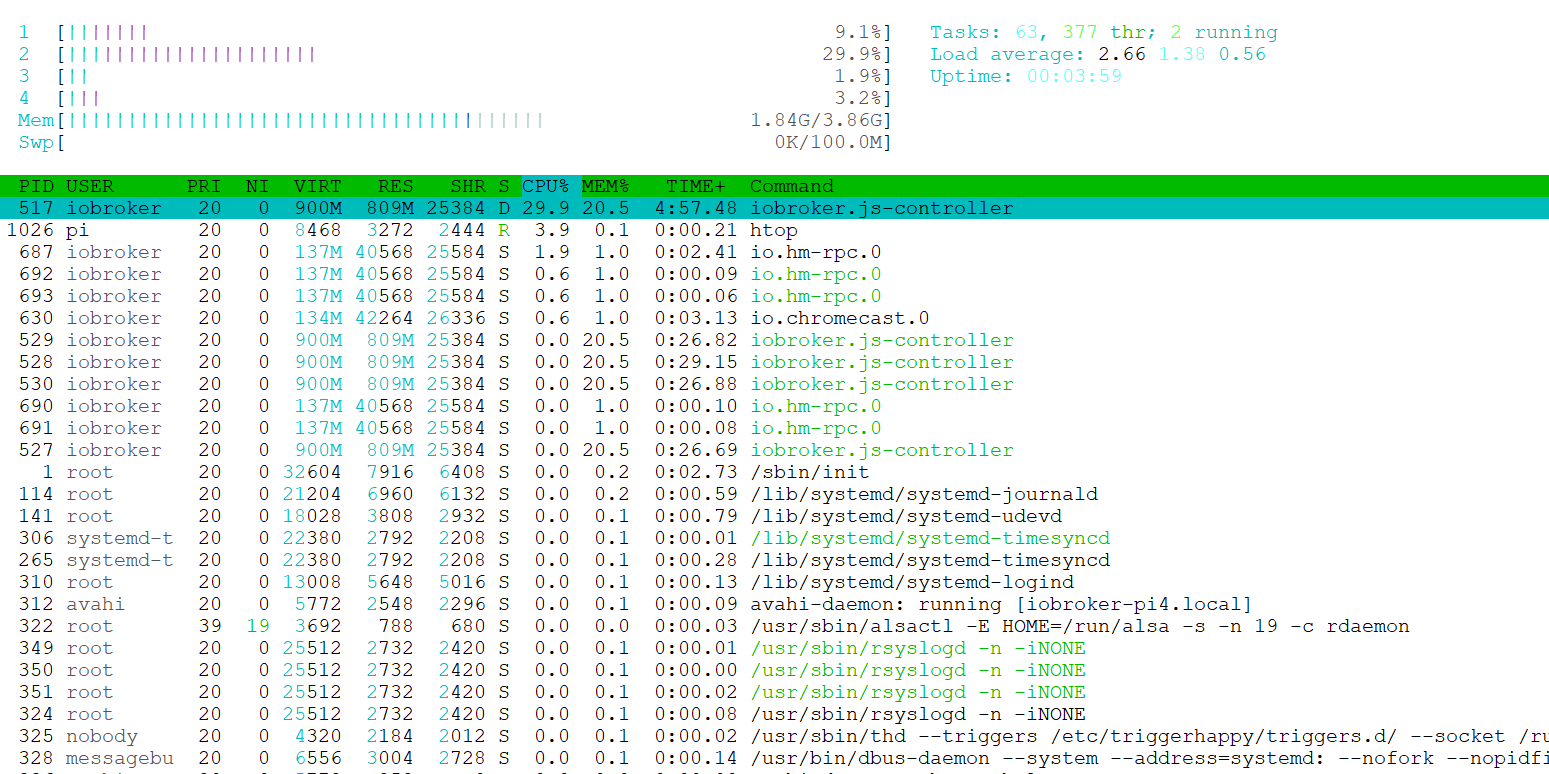
Hier auch mal ein screenshot von top (bei dem man im Gegensatz zu htop jeden Prozess auch nur ein mal sieht):
-
@miggedy sagte in admin Seiten laden extrem langsam bis gar nicht:
Hier auch mal ein screenshot von top
Danke, darum hatte ich gebeten.
@miggedy
Code bitte als Text in Code-Tags! Dann kann man auch zitieren.Load average 1 Minute liegt bei knapp 4, das ist viel zu hoch
unmittelbar nach dem reboot muss allerdings ggf. noch einiges organisiert werden.Trotzdem gefällt mir das gar nicht.
Hattest du irgendwelche Updates gemacht und ggf. die notwendigen Abhängigkeiten (js-controller, admin, nodejs) nicht beachtet.
Oder ein "unfachmännisches" restore durchgeführt? -
Ja, sicher war da auch noch ein bisschen was am starten als ich den Screenshot gemacht hab.
Jetzt sollte sich eigentlich alles beruhigt haben.
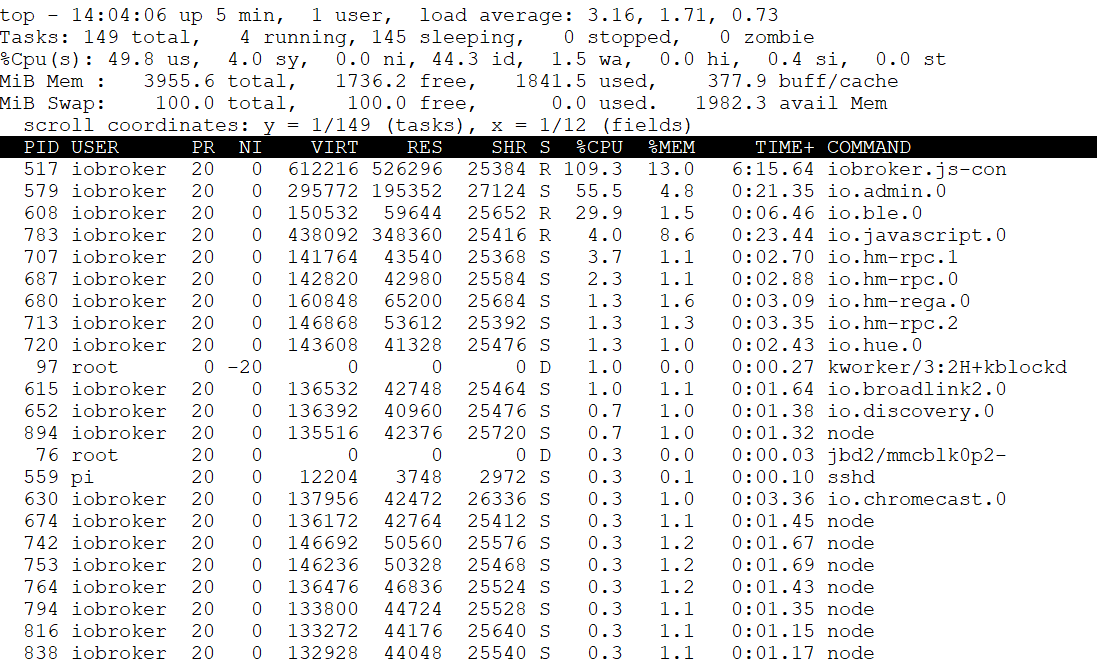
Hier nun mal ein aktueller Status von toptop - 14:15:28 up 16 min, 1 user, load average: 2.08, 2.99, 2.21 Tasks: 140 total, 2 running, 138 sleeping, 0 stopped, 0 zombie %Cpu(s): 44.1 us, 8.4 sy, 0.0 ni, 43.8 id, 3.1 wa, 0.0 hi, 0.6 si, 0.0 st MiB Mem : 3955.6 total, 2068.5 free, 1420.2 used, 466.9 buff/cache MiB Swap: 100.0 total, 100.0 free, 0.0 used. 2401.6 avail Mem scroll coordinates: y = 1/140 (tasks), x = 1/13 (fields) PID USER PR NI VIRT RES SHR S %CPU %MEM TIME+ COMMAND SWAP 517 iobroker 20 0 334496 246352 25760 R 127.9 6.1 17:29.27 iobroker.js-con 0 907 iobroker 20 0 196340 94532 25744 S 11.3 2.3 0:36.63 io.sql.0 0 608 iobroker 20 0 163364 66924 25656 S 11.0 1.7 1:25.14 io.ble.0 0 579 iobroker 20 0 284756 182076 27128 S 9.0 4.5 1:30.13 io.admin.0 0 783 iobroker 20 0 384364 282588 27772 S 8.3 7.0 6:39.58 io.javascript.0 0 764 iobroker 20 0 155892 55092 26372 S 7.6 1.4 0:10.67 io.info.0 0 871 iobroker 20 0 181500 79780 25624 S 6.3 2.0 0:30.88 io.scenes.0 0 951 iobroker 20 0 158760 53476 26196 S 2.0 1.3 0:11.76 io.web.0 0 75 root 0 -20 0 0 0 I 1.3 0.0 0:04.38 kworker/0:1H-mmc_complete 0 674 iobroker 20 0 144364 40700 25512 S 1.3 1.0 0:03.75 io.gruenbeck.0 0 805 iobroker 20 0 134572 40284 25476 S 1.0 1.0 0:04.71 io.mihome-vacuu 0 966 iobroker 20 0 134600 40536 25724 S 1.0 1.0 0:04.30 io.mihome-vacuu 0 7190 iobroker 20 0 146148 49816 25592 S 1.0 1.2 0:01.87 node 0 838 iobroker 20 0 133952 40736 25540 S 0.7 1.0 0:05.34 io.ping.0 0 352 root 20 0 27656 80 0 S 0.3 0.0 0:00.20 rngd 0 615 iobroker 20 0 139604 40092 25464 S 0.3 1.0 0:02.92 io.broadlink2.0 0 687 iobroker 20 0 147600 49592 25588 S 0.3 1.2 0:05.77 io.hm-rpc.0 0 720 iobroker 20 0 153608 51888 25480 S 0.3 1.3 0:09.62 io.hue.0 0 816 iobroker 20 0 137368 39420 25640 S 0.3 1.0 0:03.02 io.mihome.0 0 831 iobroker 20 0 152236 48468 26776 S 0.3 1.2 0:02.74 io.netatmo.0 0 857 iobroker 20 0 136948 40776 25576 S 0.3 1.0 0:02.08 io.pushover.0 0 1363 pi 20 0 10316 3132 2600 R 0.3 0.1 0:02.05 top 0 1 root 20 0 32604 7916 6408 S 0.0 0.2 0:02.75 systemd 0 2 root 20 0 0 0 0 S 0.0 0.0 0:00.00 kthreadd 0 3 root 0 -20 0 0 0 I 0.0 0.0 0:00.00 rcu_gp 0 4 root 0 -20 0 0 0 I 0.0 0.0 0:00.00 rcu_par_gp 0 8 root 0 -20 0 0 0 I 0.0 0.0 0:00.00 mm_percpu_wq 0 9 root 20 0 0 0 0 S 0.0 0.0 0:00.19 ksoftirqd/0 0 10 root 20 0 0 0 0 I 0.0 0.0 0:00.76 rcu_sched 0 11 root 20 0 0 0 0 I 0.0 0.0 0:00.00 rcu_bh 0 12 root rt 0 0 0 0 S 0.0 0.0 0:00.03 migration/0 0 13 root 20 0 0 0 0 S 0.0 0.0 0:00.00 cpuhp/0 0 14 root 20 0 0 0 0 S 0.0 0.0 0:00.00 cpuhp/1 0 15 root rt 0 0 0 0 S 0.0 0.0 0:00.03 migration/1 0Ein Restore ist das System nicht. Das wurde vor ein paar Monaten frisch sauber aufgezogen.
Updates sind eigentlich immer sauber gelaufen. Nodejs hatte ich letztens vom von einer 10 Version auf sie aktuelle geupdated (also kein großer Versionssprung). Bin aber auch da nach Anleitung vorgegangen und mir sind zumindest keine Fehler aufgefallen.
Allerdings habe ich seitdem auch das Problem, dass der Adapter mihome-vacuum sich nicht mehr updaten lässt:pi@iobroker-pi4:~ $ iobroker upgrade mihome-vacuum Update mihome-vacuum from @1.1.5 to @2.0.7 NPM version: 6.13.4 npm install iobroker.mihome-vacuum@2.0.7 --loglevel error --prefix "/opt/iobroker" (System call) Package pixman-1 was not found in the pkg-config search path. Perhaps you should add the directory containing `pixman-1.pc' to the PKG_CONFIG_PATH environment variable No package 'pixman-1' found gyp: Call to 'pkg-config pixman-1 --libs' returned exit status 1 while in binding.gyp. while trying to load binding.gyp gyp ERR! configure error gyp ERR! stack Error: `gyp` failed with exit code: 1 gyp ERR! stack at ChildProcess.onCpExit (/usr/lib/node_modules/npm/node_modules/node-gyp/lib/configure.js:351:16) gyp ERR! stack at ChildProcess.emit (events.js:198:13) gyp ERR! stack at Process.ChildProcess._handle.onexit (internal/child_process.js:248:12) gyp ERR! System Linux 4.19.75-v7l+ gyp ERR! command "/usr/bin/node" "/usr/lib/node_modules/npm/node_modules/node-gyp/bin/node-gyp.js" "configure" "--fallback-to-build" "--module=/opt/iobroker/node_modules/canvas/build/Release/canvas.node" "--module_name=canvas" "--module_path=/opt/iobroker/node_modules/canvas/build/Release" "--napi_version=5" "--node_abi_napi=napi" "--napi_build_version=0" "--node_napi_label=node-v64" gyp ERR! cwd /opt/iobroker/node_modules/canvas gyp ERR! node -v v10.19.0 gyp ERR! node-gyp -v v5.0.5 gyp ERR! not ok node-pre-gyp ERR! build error node-pre-gyp ERR! stack Error: Failed to execute '/usr/bin/node /usr/lib/node_modules/npm/node_modules/node-gyp/bin/node-gyp.js configure --fallback-to-build --module=/opt/iobroker/node_modules/canvas/build/Release/canvas.node --module_name=canvas --module_path=/opt/iobroker/node_modules/canvas/build/Release --napi_version=5 --node_abi_napi=napi --napi_build_version=0 --node_napi_label=node-v64' (1) node-pre-gyp ERR! stack at ChildProcess.<anonymous> (/opt/iobroker/node_modules/canvas/node_modules/node-pre-gyp/lib/util/compile.js:83:29) node-pre-gyp ERR! stack at ChildProcess.emit (events.js:198:13) node-pre-gyp ERR! stack at maybeClose (internal/child_process.js:982:16) node-pre-gyp ERR! stack at Process.ChildProcess._handle.onexit (internal/child_process.js:259:5) node-pre-gyp ERR! System Linux 4.19.75-v7l+ node-pre-gyp ERR! command "/usr/bin/node" "/opt/iobroker/node_modules/canvas/node_modules/.bin/node-pre-gyp" "install" "--fallback-to-build" node-pre-gyp ERR! cwd /opt/iobroker/node_modules/canvas node-pre-gyp ERR! node -v v10.19.0 node-pre-gyp ERR! node-pre-gyp -v v0.11.0 node-pre-gyp ERR! not ok npm ERR! code ELIFECYCLE npm ERR! errno 1 npm ERR! canvas@2.6.1 install: `node-pre-gyp install --fallback-to-build` npm ERR! Exit status 1 npm ERR! npm ERR! Failed at the canvas@2.6.1 install script. npm ERR! This is probably not a problem with npm. There is likely additional logging output above. npm ERR! A complete log of this run can be found in: npm ERR! /home/iobroker/.npm/_logs/2020-03-21T13_21_25_337Z-debug.log host.iobroker-pi4 Cannot install iobroker.mihome-vacuum@2.0.7: 1Da alle anderen Adapter sich aber problemlos updaten lassen, bin ich da eher von einem Problem bei diesem einen Adapter ausgegangen anstatt bei meinem System.
-
@miggedy sagte in admin Seiten laden extrem langsam bis gar nicht:
Jetzt sollte sich eigentlich alles beruhigt haben.
ist immer noch zu hoch. Auf meinem Pi4 2GB sieht es so aus:
top - 14:31:22 up 43 days, 21:09,  1 user,  load average: 1,48, 0,75, 0,59
Tasks: 134 total,   1 running, 133 sleeping,   0 stopped,   0 zombie
%Cpu(s):  4,1 us,  0,5 sy,  0,0 ni, 95,3 id,  0,0 wa,  0,0 hi,  0,1 si,  0,0 st
MiB Mem :   1939,5 total,    409,1 free,   1187,7 used,    342,6 buff/cache
MiB Swap:    100,0 total,     72,0 free,     28,0 used.    610,1 avail Mem

  PID USER      PR  NI    VIRT    RES    SHR S  %CPU  %MEM     TIME+ COMMAND
 1728 iobroker  20   0  227520 121108  25940 S   7,9   6,1   5998:17 iobroker.js-con
 2338 iobroker  20   0  182944  80740  25608 S   5,3   4,1   1994:42 io.enigma2.0
27541 iobroker  20   0  224592 121316  26516 S   1,7   6,1 918:33.44 io.javascript.0
 2173 iobroker  20   0  190244  86188  25596 S   0,0   4,3 241:51.81 io.rpi2.0
26819 iobroker  20   0  176560  76628  25696 S   0,0   3,9 200:25.35 io.hm-rega.0
 7308 iobroker  20   0  241376 146356  27148 S   0,0   7,4 172:15.90 io.radar2.0
24651 iobroker  20   0  190064  84704  26452 S   0,7   4,3 130:16.54 io.admin.0
27752 iobroker  20   0  166012  70404  25668 S   0,0   3,5 106:42.54 io.hm-rpc.1
 6703 iobroker  20   0  172532  73088  25528 S   1,3   3,7  74:52.38 io.hm-rpc.0
18585 iobroker  20   0  180492  77276  26508 S   0,0   3,9  73:39.70 io.parser.0
23628 iobroker  20   0  178588  71904  25528 S   1,7   3,6  68:39.42 io.history.0
 2353 iobroker  20   0  171444  69640  26256 S   0,3   3,5  62:23.61 io.web.0
 3271 iobroker  20   0  166860  68052  25672 S   0,3   3,4  60:15.84 io.denon.0
 1761 iobroker  20   0  169560  64372  26428 S   0,3   3,2  54:22.43 io.info.0
 2304 iobroker  20   0  178568  77820  25572 S   0,0   3,9  46:37.30 io.calendar.0
31970 iobroker  20   0  171052  69000  25572 S   0,0   3,5  44:00.08 io.snmp.0
16766 iobroker  20   0  172988  69656  25792 S   0,0   3,5  31:58.95 io.tradfri.0
   10 root      20   0       0      0      0 I   0,0   0,0  29:53.99 rcu_sched
16777 iobroker  20   0  168272  66612  25596 S   0,0   3,4  28:42.17 io.tradfri.1
 2074 iobroker  20   0  180860  80536  25620 S   0,0   4,1  21:48.10 io.backitup.0
30839 root       0 -20       0      0      0 I   0,0   0,0  12:42.36 kworker/0:2H-kblockd
   98 root       0 -20       0      0      0 I   0,0   0,0   8:23.00 kworker/2:2H-kblockd
   78 root       0 -20       0      0      0 I   0,0   0,0   8:18.94 kworker/1:1H-kblockd
die erhöhte load-average 1min kommt durch das einloggen mit putty
@miggedy sagte in admin Seiten laden extrem langsam bis gar nicht:
Nodejs hatte ich letztens vom von einer 10 Version auf sie aktuelle geupdated (also kein großer Versionssprung). Bin aber auch da nach Anleitung vorgegangen
welche Anleitung?
innerhalb eines major release wird mitapt update && apt upgradeaktualisiert.nodejs und npm scheinen aktuell zu sein.
controller und admin auchSchuss ins Blaue:
mach mal ein npm rebuild im Installationsordner
und jag den fixer hinterher -
@miggedy sagte:
Hier nun mal ein aktueller Status von top
Eine CPU-Last von 128 % durch den JS-Controller ist viel zu hoch. Wie verändert sie sich, wenn alle Instanzen - außer admin.0 - deaktiviert werden ?
-
Mache mich gerade an das "npm rebuild". Das bricht mit einem Fehler ab.
make: *** [bufferutil.target.mk:103: Release/obj.target/bufferutil/src/bufferutil.o] Error 1
make: Leaving directory '/opt/iobroker/node_modules/kodi-ws/node_modules/bufferutil/build'
gyp ERR! build error
gyp ERR! stack Error: `make` failed with exit code: 2
gyp ERR! stack     at ChildProcess.onExit (/usr/lib/node_modules/npm/node_modules/node-gyp/lib/build.js:191:23)
gyp ERR! stack     at ChildProcess.emit (events.js:198:13)
gyp ERR! stack     at Process.ChildProcess._handle.onexit (internal/child_process.js:248:12)
gyp ERR! System Linux 4.19.75-v7l+
gyp ERR! command "/usr/bin/node" "/usr/lib/node_modules/npm/node_modules/node-gyp/bin/node-gyp.js" "rebuild"
gyp ERR! cwd /opt/iobroker/node_modules/kodi-ws/node_modules/bufferutil
gyp ERR! node -v v10.19.0
gyp ERR! node-gyp -v v5.0.5
gyp ERR! not ok
npm ERR! code ELIFECYCLE
npm ERR! errno 1
npm ERR! bufferutil@1.1.0 install: `node-gyp rebuild`
npm ERR! Exit status 1
npm ERR!
npm ERR! Failed at the bufferutil@1.1.0 install script.
npm ERR! This is probably not a problem with npm. There is likely additional logging output above.

npm ERR! A complete log of this run can be found in:
npm ERR!     /home/iobroker/.npm/_logs/2020-03-21T13_53_22_130Z-debug.log
Das genannte log file endet mit:
8190 info lifecycle bufferutil@1.1.0~install: bufferutil@1.1.0
8191 verbose lifecycle bufferutil@1.1.0~install: unsafe-perm in lifecycle true
8192 verbose lifecycle bufferutil@1.1.0~install: PATH: /usr/lib/node_modules/npm/node_modules/npm-lifecycle/node-gyp-bin:/opt/iobroker/node_modules/kodi-ws/node_modules/bufferutil/node_modules/.bin:/opt/iobroker/node_modules/kodi-ws/node_modules/.bin:/opt/iobroker/node_modules/.bin:/usr/local/sbin:/usr/local/bin:/usr/sbin:/usr/bin:/sbin:/bin
8193 verbose lifecycle bufferutil@1.1.0~install: CWD: /opt/iobroker/node_modules/kodi-ws/node_modules/bufferutil
8194 silly lifecycle bufferutil@1.1.0~install: Args: [ '-c', 'node-gyp rebuild' ]
8195 silly lifecycle bufferutil@1.1.0~install: Returned: code: 1  signal: null
8196 info lifecycle bufferutil@1.1.0~install: Failed to exec install script
8197 verbose stack Error: bufferutil@1.1.0 install: `node-gyp rebuild`
8197 verbose stack Exit status 1
8197 verbose stack     at EventEmitter.<anonymous> (/usr/lib/node_modules/npm/node_modules/npm-lifecycle/index.js:332:16)
8197 verbose stack     at EventEmitter.emit (events.js:198:13)
8197 verbose stack     at ChildProcess.<anonymous> (/usr/lib/node_modules/npm/node_modules/npm-lifecycle/lib/spawn.js:55:14)
8197 verbose stack     at ChildProcess.emit (events.js:198:13)
8197 verbose stack     at maybeClose (internal/child_process.js:982:16)
8197 verbose stack     at Process.ChildProcess._handle.onexit (internal/child_process.js:259:5)
8198 verbose pkgid bufferutil@1.1.0
8199 verbose cwd /opt/iobroker
8200 verbose Linux 4.19.75-v7l+
8201 verbose argv "/usr/bin/node" "/usr/bin/npm" "rebuild"
8202 verbose node v10.19.0
8203 verbose npm  v6.13.4
8204 error code ELIFECYCLE
8205 error errno 1
8206 error bufferutil@1.1.0 install: `node-gyp rebuild`
8206 error Exit status 1
8207 error Failed at the bufferutil@1.1.0 install script.
8207 error This is probably not a problem with npm. There is likely additional logging output above.
8208 verbose exit [ 1, true ]
Ist es richtig, dass ich das npm rebuild als "pi" user aufrufe oder sollte ich sudo machen oder es als "iobroker" user ausführen?
Nach dem tutorial bin ich damals übrigens vorgegangen: https://forum.iobroker.net/topic/22867/how-to-node-js-für-iobroker-richtig-updaten
Hatte also damals auch schon ein npm rebuild gemacht. Langsam zweifele ich aber an meiner Erinnerung, dass das damals alles sauber durchgelaufen ist.")
-
@miggedy sagte in admin Seiten laden extrem langsam bis gar nicht:
Nach dem tutorial
das gilt eben nur für einen Wechsel des major releases: z.B. 8.x -> 10.x, nicht innerhalb von 10.x
@miggedy sagte in admin Seiten laden extrem langsam bis gar nicht:
dass ich das npm rebuild als "pi" user aufrufe
ja!
https://forum.iobroker.net/topic/17109/wichtige-hinweise-bei-neueren-npm-versionen-und-sudo/1 -
@miggedy Bei dem mivacuum Adapter muss manuel noch canvas nachinstalliert werden. Siehe auch auf der git-Seite zum Adapter.
-
Ich habe den Kodi Adapter mal gelöscht, da dieser beim npm rebuild ja Probleme gemacht hat. Danach war das npm rebuild auch erfolgreich. Dann ein "iobroker fix" hinterhergeschoben. Auch erfolgreich.
Geändert hat das allerdings nichts. CPU weiterhin so hoch und admin lädt weiterhin so langsam bis gar nicht.@Thomas-Braun, das habe ich direkt mal gemacht und konnte nun ohne Probleme updaten. Danke.
-
@miggedy dann mach bitte was @paul53 geschrieben hat:
@paul53 sagte in admin Seiten laden extrem langsam bis gar nicht:
Wie verändert sie sich, wenn alle Instanzen - außer admin.0 - deaktiviert werden ?
-
Hab nach und nach immer mehr Instanzen raus genommen. Wie zu erwarten ging die load average immer etwas weiter runter, die admin Seiten laden aber noch immer recht langsam (schneller, aber noch immer ca. 1 Minute).
So sah das ganze am Ende in top aus (mit nur admin instanz noch am laufen)top - 17:11:18 up 1:18, 1 user, load average: 1.82, 1.33, 1.65 Tasks: 109 total, 2 running, 107 sleeping, 0 stopped, 0 zombie %Cpu(s): 28.4 us, 0.6 sy, 0.0 ni, 71.0 id, 0.0 wa, 0.0 hi, 0.0 si, 0.0 st MiB Mem : 3955.6 total, 2359.0 free, 708.4 used, 888.2 buff/cache MiB Swap: 100.0 total, 100.0 free, 0.0 used. 3090.6 avail Mem scroll coordinates: y = 1/109 (tasks), x = 1/12 (fields) PID USER PR NI VIRT RES SHR S %CPU %MEM TIME+ COMMAND 16947 iobroker 20 0 461636 371768 26096 R 59.9 9.2 42:32.93 iobroker.js-con 16981 iobroker 20 0 384892 297708 27468 S 56.6 7.3 7:09.40 io.admin.0 641 pi 20 0 12204 4140 3340 S 0.3 0.1 0:02.30 sshd 19875 pi 20 0 10188 2912 2548 R 0.3 0.1 0:00.13 top 1 root 20 0 33696 7992 6296 S 0.0 0.2 0:03.89 systemd 2 root 20 0 0 0 0 S 0.0 0.0 0:00.01 kthreadd 3 root 0 -20 0 0 0 I 0.0 0.0 0:00.00 rcu_gp 4 root 0 -20 0 0 0 I 0.0 0.0 0:00.00 rcu_par_gp 8 root 0 -20 0 0 0 I 0.0 0.0 0:00.00 mm_percpu_wq 9 root 20 0 0 0 0 S 0.0 0.0 0:00.71 ksoftirqd/0 10 root 20 0 0 0 0 I 0.0 0.0 0:03.18 rcu_sched 11 root 20 0 0 0 0 I 0.0 0.0 0:00.00 rcu_bh 12 root rt 0 0 0 0 S 0.0 0.0 0:00.07 migration/0 13 root 20 0 0 0 0 S 0.0 0.0 0:00.00 cpuhp/0 14 root 20 0 0 0 0 S 0.0 0.0 0:00.00 cpuhp/1 15 root rt 0 0 0 0 S 0.0 0.0 0:00.10 migration/1Hab mittlerweile den log level des js-controler über die iobroker.json auf "debug" gesetzt. Der log gibt aber weiterhin keinerlei Aufschlüsse darüber was hier los sein soll.
-
@miggedy sagte in admin Seiten laden extrem langsam bis gar nicht:
So sah das ganze am Ende in top aus
Also läuft nichts außer dem admin?
Dann sind 59% CPU und ein load average von 1.8 ein Vielfaches zu hoch -
Richtig. Nur admin läuft noch.
Hab auch schon mal iobroker gestoppt und dann geschaut um sicher zu gehen ob nicht irgendwas anderes auf der Kiste läuft und die Probleme macht. Aber nein, dann ist CPU komplett runter. Liegt also definitiv am iobroker selbst.Kann man den iobroker.js-connection neuinstallieren oder so? Scheint ja wirklich an diesem zu liegen und an keinem Adapter (maximal noch am admin adapter).
-
@miggedy sagte in admin Seiten laden extrem langsam bis gar nicht:
an keinem Adapter.
der admin, der ja jetzt gar nichts zu tun hat liegt auch bei knapp 60%
ich hoffe das ist jetzt richtig!! aus dem Kopf:
npm install iobroker.js-controller --productionunbedingt im Verzeichnis /opt/iobroker ausführen!!
oder wo auch immer bei dir ioBroker installiert ist -
js-controller wie von dir angegeben fehlerlos aktualisiert. Danach noch
iobroker del adminundiobroker add admin.
Aber keine Verbesserung. Das initiale Laden der admin Seite dauert ewig. Wenn die Seite ein mal da ist, geht die CPU runter und man kann auch problemlos zwischen den Menüpunkten des admin hin und herspringen. Echt seltsam. -
Kann es sein, dass irgendwas mit meinen Objekten nicht stimmt? Kann man die prüfen/reparieren lassen oder so?
-
@miggedy sagte in admin Seiten laden extrem langsam bis gar nicht:
iobroker add admin.
dann wird er wahrscheinlich wieder aus dem npm-cache installiert.
Falls der Fehler an dem admin liegt sollte er auch über npm mit --production installiert werden@miggedy sagte in admin Seiten laden extrem langsam bis gar nicht:
Das initiale Laden der admin Seite dauert ewig.
Das könnte ein Indiz dafür sein - muss aber nicht
@miggedy sagte in admin Seiten laden extrem langsam bis gar nicht:
Kann man die prüfen/reparieren lassen oder so?
Auch das ist eine Option, wenn z.B. unzulässige Zeichen in den IDs sind.
ein Backup vorausgesetzt, kannst du ja alle Datenpunkte löschen
Beim Neustart der Instanzen werden diese ja wieder angelegt. (außer manuell angelegte - die kannst du ja vorher exportieren [ohne Werte allerdings]) -
Habe admin nun auch mit
npm install iobroker.admin --productionaktualisiert und dabei folgende Warnungen bekommen. Die sind aber nicht wirklich ein Problem, oder?pi@iobroker-pi4:/opt/iobroker $ npm install iobroker.admin --production npm WARN enoent ENOENT: no such file or directory, open '/opt/iobroker/node_modules/bufferutil/package.json' npm WARN enoent ENOENT: no such file or directory, open '/opt/iobroker/node_modules/sqlite3/package.json' npm WARN enoent ENOENT: no such file or directory, open '/opt/iobroker/node_modules/utf-8-validate/package.json' npm WARN moment-feiertage@2.0.1 requires a peer of moment@2.15.x but none is installed. You must install peer dependencies yourself. npm WARN xmlhttprequest-ts@1.0.1 requires a peer of @angular/common@>= 5.0.0 butnone is installed. You must install peer dependencies yourself. npm WARN xmlhttprequest-ts@1.0.1 requires a peer of @angular/core@>= 5.0.0 but none is installed. You must install peer dependencies yourself.Nach dem update gab es leider auch keine Besserung.
Werde dann wohl mal die Neulanlage aller Datenpunkte machen müssen.
-
@miggedy sagte in admin Seiten laden extrem langsam bis gar nicht:
folgende Warnungen bekommen. Die sind aber nicht wirklich ein Problem
ENOENT klingt für mich nicht beruhigend, aber es ist ja nur ein WARN.
kann ich dir aber nicht wirklich sagen. Da müsste ein wissender etwas zu sagen.
-
Das Problem ist identifiziert. Der BLE Adapter hatte fast 160.000 Objekte angelegt. Die objects.json war dadurch fast 80MB groß.
BLE Adapter gelöscht, alles wieder gut.")
Also wenn jemand ähnliches feststellt, am Besten mal die objects.json überprüfen ob die unnormal groß ist. Meine schätzungsweise leicht überdurchschnittlich umfangreiche Installation hat z.B. nun eine Größe von 6,5 MB.
Ist die Datei sehr groß könnte das ein Hinweis sein, dass da was nicht stimmt. Da solche großen JSON Dateien für viele Programme zu groß sind um sie zu untersuchen, habe ich den HugeJsonViewer verwendet. Beim einfachen durchscrollen der Datei ist sofort aufgefallen, dass der BLE Adapter Unmengen an Objekten hatte.Herzlichen Dank @Homoran für deine geduldige Hilfe.
