Navigation

    Logo
    • Register
    • Login
    • Search
    • Recent
    • Tags
    • Unread
    • Categories
    • Unreplied
    • Popular
    • GitHub
    • Docu
    • Hilfe
    1. Home
    2. Deutsch
    3. Visualisierung
    4. Grafana Tagesverbrauch

    NEWS

    • ioBroker@Smart Living Forum Solingen, 14.06. - Agenda added

    • ioBroker goes Matter ... Matter Adapter in Stable

    • Monatsrückblick - April 2025

    Grafana Tagesverbrauch

    This topic has been deleted. Only users with topic management privileges can see it.
    • Negalein
      Negalein Global Moderator @crunchip last edited by

      @crunchip sagte in Grafana Tagesverbrauch:

      bist du sicher das die Bezeichnung richtig geschrieben ist? kommt mir irgendwie etwas komisch vor mit dem...hs100__0__10....(die doppelten unterstriche)

      Ja, gerade nochmal geschaut.

      So siehts in Source aus:
      objects - ioBroker (7).png

      Und so die DP:
      zB der sourceanalytix.0.hs100__0__10_0_1_80__power.Meter_Readings.Current_Reading
      objects - ioBroker (8).png

      crunchip 1 Reply Last reply Reply Quote 0
      • crunchip
        crunchip Forum Testing Most Active @Negalein last edited by

        @Negalein mach mal ein neues dasboard füge die json ein...und natürlich deinen Datenpunkt anpassen

        {
         "__inputs": [
           {
             "name": "DS_INFLUXDB",
             "label": "InfluxDB",
             "description": "",
             "type": "datasource",
             "pluginId": "influxdb",
             "pluginName": "InfluxDB"
           }
         ],
         "__requires": [
           {
             "type": "panel",
             "id": "gauge",
             "name": "Gauge",
             "version": ""
           },
           {
             "type": "grafana",
             "id": "grafana",
             "name": "Grafana",
             "version": "6.5.2"
           },
           {
             "type": "panel",
             "id": "grafana-piechart-panel",
             "name": "Pie Chart",
             "version": "1.4.0"
           },
           {
             "type": "panel",
             "id": "graph",
             "name": "Graph",
             "version": ""
           },
           {
             "type": "datasource",
             "id": "influxdb",
             "name": "InfluxDB",
             "version": "1.0.0"
           },
           {
             "type": "panel",
             "id": "yesoreyeram-boomtheme-panel",
             "name": "Boom Theme",
             "version": "0.1.0"
           }
         ],
         "annotations": {
           "list": [
             {
               "builtIn": 1,
               "datasource": "-- Grafana --",
               "enable": true,
               "hide": true,
               "iconColor": "rgba(0, 211, 255, 1)",
               "name": "Annotations & Alerts",
               "type": "dashboard"
             }
           ]
         },
         "editable": true,
         "gnetId": null,
         "graphTooltip": 0,
         "id": null,
         "links": [
           {
             "asDropdown": false,
             "icon": "dashboard",
             "tags": [
               "Strom"
             ],
             "title": "Strom",
             "tooltip": "",
             "type": "dashboards"
           }
         ],
         "panels": [
           {
             "activeThemeId": 0,
             "datasource": "${DS_INFLUXDB}",
             "disableThemePicker": true,
             "gridPos": {
               "h": 3,
               "w": 24,
               "x": 0,
               "y": 0
             },
             "id": 12,
             "options": {},
             "targets": [
               {
                 "groupBy": [
                   {
                     "params": [
                       "$__interval"
                     ],
                     "type": "time"
                   },
                   {
                     "params": [
                       "null"
                     ],
                     "type": "fill"
                   }
                 ],
                 "orderByTime": "ASC",
                 "policy": "default",
                 "refId": "A",
                 "resultFormat": "time_series",
                 "select": [
                   [
                     {
                       "params": [
                         "value"
                       ],
                       "type": "field"
                     },
                     {
                       "params": [],
                       "type": "mean"
                     }
                   ]
                 ],
                 "tags": []
               }
             ],
             "themes": [
               {
                 "name": "Night Theme",
                 "styles": [
                   {
                     "props": {
                       "theme": "default"
                     },
                     "type": "basetheme"
                   },
                   {
                     "props": {
                       "url": "https://images.unsplash.com/photo-1524334228333-0f6db392f8a1"
                     },
                     "type": "bgimage"
                   },
                   {
                     "props": {
                       "text": ".panel-container {\n    background-color: rgba(0,0,0,0.3);\n}"
                     },
                     "type": "style"
                   }
                 ]
               },
               {
                 "name": "Theme 2",
                 "styles": [
                   {
                     "props": {
                       "theme": "light"
                     },
                     "type": "basetheme"
                   },
                   {
                     "props": {
                       "url": "/public/img/hintergrund/energie.jpg"
                     },
                     "type": "bgimage"
                   },
                   {
                     "props": {
                       "text": ""
                     },
                     "type": "style"
                   }
                 ]
               }
             ],
             "timeFrom": null,
             "timeShift": null,
             "title": "",
             "transparent": true,
             "type": "yesoreyeram-boomtheme-panel"
           },
           {
             "aliasColors": {
               "Stromverbrauch": "semi-dark-green"
             },
             "bars": true,
             "dashLength": 10,
             "dashes": false,
             "datasource": "${DS_INFLUXDB}",
             "fill": 1,
             "fillGradient": 0,
             "gridPos": {
               "h": 5,
               "w": 21,
               "x": 0,
               "y": 3
             },
             "hiddenSeries": false,
             "id": 2,
             "interval": "10s",
             "legend": {
               "avg": true,
               "current": false,
               "max": true,
               "min": false,
               "show": true,
               "total": false,
               "values": true
             },
             "lines": false,
             "linewidth": 1,
             "links": [],
             "nullPointMode": "null",
             "options": {
               "dataLinks": []
             },
             "percentage": false,
             "pointradius": 2,
             "points": false,
             "renderer": "flot",
             "seriesOverrides": [],
             "spaceLength": 10,
             "stack": true,
             "steppedLine": false,
             "targets": [
               {
                 "alias": "Stromverbrauch",
                 "groupBy": [
                   {
                     "params": [
                       "24h"
                     ],
                     "type": "time"
                   },
                   {
                     "params": [
                       "null"
                     ],
                     "type": "fill"
                   }
                 ],
                 "measurement": "wiffi-wz.0.root.192_168_178_33.w_counter_1",
                 "orderByTime": "ASC",
                 "policy": "default",
                 "query": "SELECT non_negative_difference(last(cumulative_sum))FROM (\nSELECT cumulative_sum(non_negative_difference(last(\"value\"))) FROM \"wiffi-wz.0.root.10_1_30_10.w_counter_1\" WHERE $timeFilter GROUP BY time(1d)\n) WHERE $timeFilter GROUP BY time(1d) tz('Europe/Berlin')",
                 "rawQuery": true,
                 "refId": "A",
                 "resultFormat": "time_series",
                 "select": [
                   [
                     {
                       "params": [
                         "value"
                       ],
                       "type": "field"
                     },
                     {
                       "params": [],
                       "type": "mean"
                     }
                   ]
                 ],
                 "tags": []
               }
             ],
             "thresholds": [],
             "timeFrom": null,
             "timeRegions": [],
             "timeShift": null,
             "title": "Strom",
             "tooltip": {
               "shared": true,
               "sort": 0,
               "value_type": "cumulative"
             },
             "transparent": true,
             "type": "graph",
             "xaxis": {
               "buckets": null,
               "mode": "time",
               "name": null,
               "show": true,
               "values": []
             },
             "yaxes": [
               {
                 "format": "kwatth",
                 "label": null,
                 "logBase": 1,
                 "max": null,
                 "min": null,
                 "show": true
               },
               {
                 "format": "short",
                 "label": null,
                 "logBase": 1,
                 "max": null,
                 "min": null,
                 "show": true
               }
             ],
             "yaxis": {
               "align": false,
               "alignLevel": null
             }
           },
           {
             "cacheTimeout": null,
             "datasource": "${DS_INFLUXDB}",
             "gridPos": {
               "h": 5,
               "w": 3,
               "x": 21,
               "y": 3
             },
             "id": 6,
             "links": [],
             "options": {
               "fieldOptions": {
                 "calcs": [
                   "last"
                 ],
                 "defaults": {
                   "decimals": 2,
                   "mappings": [
                     {
                       "id": 0,
                       "op": "=",
                       "text": "N/A",
                       "type": 1,
                       "value": "null"
                     }
                   ],
                   "max": 150,
                   "min": 0,
                   "nullValueMode": "connected",
                   "thresholds": [
                     {
                       "color": "dark-green",
                       "value": null
                     },
                     {
                       "color": "dark-yellow",
                       "value": 80
                     },
                     {
                       "color": "dark-red",
                       "value": 120
                     }
                   ],
                   "unit": "currencyEUR"
                 },
                 "override": {},
                 "values": false
               },
               "orientation": "horizontal",
               "showThresholdLabels": false,
               "showThresholdMarkers": true
             },
             "pluginVersion": "6.5.2",
             "targets": [
               {
                 "alias": "",
                 "groupBy": [
                   {
                     "params": [
                       "$__interval"
                     ],
                     "type": "time"
                   },
                   {
                     "params": [
                       "null"
                     ],
                     "type": "fill"
                   }
                 ],
                 "measurement": "sourceanalytix.0.wiffi-wz__0__root__10_1_30_10__w_counter_1.cost.03_current_month",
                 "orderByTime": "ASC",
                 "policy": "default",
                 "refId": "A",
                 "resultFormat": "time_series",
                 "select": [
                   [
                     {
                       "params": [
                         "value"
                       ],
                       "type": "field"
                     },
                     {
                       "params": [],
                       "type": "distinct"
                     }
                   ]
                 ],
                 "tags": []
               }
             ],
             "timeFrom": null,
             "timeShift": null,
             "title": "Monatskosten",
             "transparent": true,
             "type": "gauge"
           },
           {
             "aliasColors": {
               "Gasverbrauch": "semi-dark-red"
             },
             "bars": true,
             "dashLength": 10,
             "dashes": false,
             "datasource": "${DS_INFLUXDB}",
             "fill": 1,
             "fillGradient": 0,
             "gridPos": {
               "h": 5,
               "w": 21,
               "x": 0,
               "y": 8
             },
             "hiddenSeries": false,
             "id": 3,
             "interval": "10s",
             "legend": {
               "avg": true,
               "current": false,
               "max": true,
               "min": false,
               "show": true,
               "total": false,
               "values": true
             },
             "lines": false,
             "linewidth": 1,
             "links": [],
             "nullPointMode": "null",
             "options": {
               "dataLinks": []
             },
             "percentage": false,
             "pointradius": 2,
             "points": false,
             "renderer": "flot",
             "seriesOverrides": [],
             "spaceLength": 10,
             "stack": true,
             "steppedLine": false,
             "targets": [
               {
                 "alias": "Gasverbrauch",
                 "groupBy": [
                   {
                     "params": [
                       "24h"
                     ],
                     "type": "time"
                   },
                   {
                     "params": [
                       "null"
                     ],
                     "type": "fill"
                   }
                 ],
                 "measurement": "wiffi-wz.0.root.10_1_30_10.w_counter_2",
                 "orderByTime": "ASC",
                 "policy": "default",
                 "query": "SELECT non_negative_difference(last(cumulative_sum))FROM (\nSELECT cumulative_sum(non_negative_difference(last(\"value\"))) FROM \"wiffi-wz.0.root.10_1_30_10.w_counter_2\" WHERE $timeFilter GROUP BY time(1d)\n) WHERE $timeFilter GROUP BY time(1d) tz('Europe/Berlin')",
                 "rawQuery": true,
                 "refId": "B",
                 "resultFormat": "time_series",
                 "select": [
                   [
                     {
                       "params": [
                         "value"
                       ],
                       "type": "field"
                     },
                     {
                       "params": [],
                       "type": "mean"
                     }
                   ]
                 ],
                 "tags": []
               }
             ],
             "thresholds": [],
             "timeFrom": null,
             "timeRegions": [],
             "timeShift": null,
             "title": "Heizung",
             "tooltip": {
               "shared": true,
               "sort": 0,
               "value_type": "cumulative"
             },
             "transparent": true,
             "type": "graph",
             "xaxis": {
               "buckets": null,
               "mode": "time",
               "name": null,
               "show": true,
               "values": []
             },
             "yaxes": [
               {
                 "format": "m3",
                 "label": null,
                 "logBase": 1,
                 "max": null,
                 "min": null,
                 "show": true
               },
               {
                 "format": "short",
                 "label": null,
                 "logBase": 1,
                 "max": null,
                 "min": null,
                 "show": true
               }
             ],
             "yaxis": {
               "align": false,
               "alignLevel": null
             }
           },
           {
             "cacheTimeout": null,
             "datasource": "${DS_INFLUXDB}",
             "gridPos": {
               "h": 5,
               "w": 3,
               "x": 21,
               "y": 8
             },
             "id": 7,
             "links": [],
             "options": {
               "fieldOptions": {
                 "calcs": [
                   "last"
                 ],
                 "defaults": {
                   "decimals": 2,
                   "mappings": [
                     {
                       "id": 0,
                       "op": "=",
                       "text": "N/A",
                       "type": 1,
                       "value": "null"
                     }
                   ],
                   "max": 200,
                   "min": 0,
                   "nullValueMode": "connected",
                   "thresholds": [
                     {
                       "color": "dark-green",
                       "value": null
                     },
                     {
                       "color": "dark-yellow",
                       "value": 130
                     },
                     {
                       "color": "dark-red",
                       "value": 170
                     }
                   ],
                   "unit": "currencyEUR"
                 },
                 "override": {},
                 "values": false
               },
               "orientation": "horizontal",
               "showThresholdLabels": false,
               "showThresholdMarkers": true
             },
             "pluginVersion": "6.5.2",
             "targets": [
               {
                 "alias": "",
                 "groupBy": [
                   {
                     "params": [
                       "$__interval"
                     ],
                     "type": "time"
                   },
                   {
                     "params": [
                       "null"
                     ],
                     "type": "fill"
                   }
                 ],
                 "measurement": "sourceanalytix.0.wiffi-wz__0__root__10_1_30_10__w_counter_2.cost.03_current_month",
                 "orderByTime": "ASC",
                 "policy": "default",
                 "refId": "A",
                 "resultFormat": "time_series",
                 "select": [
                   [
                     {
                       "params": [
                         "value"
                       ],
                       "type": "field"
                     },
                     {
                       "params": [],
                       "type": "distinct"
                     }
                   ]
                 ],
                 "tags": []
               }
             ],
             "timeFrom": null,
             "timeShift": null,
             "title": "Monatskosten",
             "transparent": true,
             "type": "gauge"
           },
           {
             "aliasColors": {
               "Wasserverbrauch": "semi-dark-blue"
             },
             "bars": true,
             "dashLength": 10,
             "dashes": false,
             "datasource": "${DS_INFLUXDB}",
             "fill": 1,
             "fillGradient": 0,
             "gridPos": {
               "h": 5,
               "w": 21,
               "x": 0,
               "y": 13
             },
             "hiddenSeries": false,
             "hideTimeOverride": false,
             "id": 4,
             "interval": "10s",
             "legend": {
               "avg": true,
               "current": false,
               "hideEmpty": false,
               "hideZero": false,
               "max": true,
               "min": false,
               "show": true,
               "total": false,
               "values": true
             },
             "lines": false,
             "linewidth": 1,
             "links": [],
             "nullPointMode": "null",
             "options": {
               "dataLinks": []
             },
             "percentage": false,
             "pointradius": 2,
             "points": false,
             "renderer": "flot",
             "seriesOverrides": [],
             "spaceLength": 10,
             "stack": true,
             "steppedLine": false,
             "targets": [
               {
                 "alias": "Wasserverbrauch",
                 "groupBy": [
                   {
                     "params": [
                       "24h"
                     ],
                     "type": "time"
                   },
                   {
                     "params": [
                       "null"
                     ],
                     "type": "fill"
                   }
                 ],
                 "measurement": "wiffi-wz.0.root.10_1_30_10.w_counter_3",
                 "orderByTime": "ASC",
                 "policy": "default",
                 "query": "SELECT non_negative_difference(last(cumulative_sum))FROM (\nSELECT cumulative_sum(non_negative_difference(last(\"value\"))) FROM \"wiffi-wz.0.root.10_1_30_10.w_counter_3\" WHERE $timeFilter GROUP BY time(1d)\n) WHERE $timeFilter GROUP BY time(1d) tz('Europe/Berlin')",
                 "rawQuery": true,
                 "refId": "A",
                 "resultFormat": "time_series",
                 "select": [
                   [
                     {
                       "params": [
                         "value"
                       ],
                       "type": "field"
                     },
                     {
                       "params": [],
                       "type": "mean"
                     }
                   ]
                 ],
                 "tags": []
               }
             ],
             "thresholds": [],
             "timeFrom": null,
             "timeRegions": [],
             "timeShift": null,
             "title": "Wasser",
             "tooltip": {
               "shared": true,
               "sort": 0,
               "value_type": "cumulative"
             },
             "transparent": true,
             "type": "graph",
             "xaxis": {
               "buckets": null,
               "mode": "time",
               "name": null,
               "show": true,
               "values": []
             },
             "yaxes": [
               {
                 "format": "m3",
                 "label": null,
                 "logBase": 1,
                 "max": null,
                 "min": null,
                 "show": true
               },
               {
                 "format": "short",
                 "label": null,
                 "logBase": 1,
                 "max": null,
                 "min": null,
                 "show": true
               }
             ],
             "yaxis": {
               "align": false,
               "alignLevel": null
             }
           },
           {
             "cacheTimeout": null,
             "datasource": "${DS_INFLUXDB}",
             "gridPos": {
               "h": 5,
               "w": 3,
               "x": 21,
               "y": 13
             },
             "id": 8,
             "links": [],
             "options": {
               "fieldOptions": {
                 "calcs": [
                   "last"
                 ],
                 "defaults": {
                   "decimals": 2,
                   "mappings": [
                     {
                       "id": 0,
                       "op": "=",
                       "text": "N/A",
                       "type": 1,
                       "value": "null"
                     }
                   ],
                   "max": 7,
                   "min": 0,
                   "nullValueMode": "connected",
                   "thresholds": [
                     {
                       "color": "dark-green",
                       "value": null
                     },
                     {
                       "color": "dark-yellow",
                       "value": 4.5
                     },
                     {
                       "color": "dark-red",
                       "value": 6
                     }
                   ],
                   "unit": "currencyEUR"
                 },
                 "override": {},
                 "values": false
               },
               "orientation": "horizontal",
               "showThresholdLabels": false,
               "showThresholdMarkers": true
             },
             "pluginVersion": "6.5.2",
             "targets": [
               {
                 "alias": "",
                 "groupBy": [
                   {
                     "params": [
                       "$__interval"
                     ],
                     "type": "time"
                   },
                   {
                     "params": [
                       "null"
                     ],
                     "type": "fill"
                   }
                 ],
                 "measurement": "sourceanalytix.0.wiffi-wz__0__root__10_1_30_10__w_counter_3.cost.03_current_month",
                 "orderByTime": "ASC",
                 "policy": "default",
                 "refId": "A",
                 "resultFormat": "time_series",
                 "select": [
                   [
                     {
                       "params": [
                         "value"
                       ],
                       "type": "field"
                     },
                     {
                       "params": [],
                       "type": "distinct"
                     }
                   ]
                 ],
                 "tags": []
               }
             ],
             "timeFrom": null,
             "timeShift": null,
             "title": "Monatskosten",
             "transparent": true,
             "type": "gauge"
           },
           {
             "aliasColors": {
               "Heizung": "#E02F44",
               "Strom": "#56A64B",
               "Wasser": "#3274D9"
             },
             "breakPoint": "50%",
             "cacheTimeout": null,
             "combine": {
               "label": "Others",
               "threshold": "0"
             },
             "datasource": "${DS_INFLUXDB}",
             "fontSize": "100%",
             "format": "currencyEUR",
             "gridPos": {
               "h": 8,
               "w": 5,
               "x": 0,
               "y": 18
             },
             "id": 10,
             "interval": null,
             "legend": {
               "percentage": true,
               "show": true,
               "values": true
             },
             "legendType": "On graph",
             "links": [],
             "maxDataPoints": 3,
             "nullPointMode": "connected",
             "options": {},
             "pieType": "pie",
             "pluginVersion": "6.5.2",
             "strokeWidth": 1,
             "targets": [
               {
                 "alias": "Strom",
                 "groupBy": [
                   {
                     "params": [
                       "$__interval"
                     ],
                     "type": "time"
                   },
                   {
                     "params": [
                       "null"
                     ],
                     "type": "fill"
                   }
                 ],
                 "measurement": "sourceanalytix.0.wiffi-wz__0__root__10_1_30_10__w_counter_1.cost.03_current_month",
                 "orderByTime": "ASC",
                 "policy": "default",
                 "refId": "A",
                 "resultFormat": "time_series",
                 "select": [
                   [
                     {
                       "params": [
                         "value"
                       ],
                       "type": "field"
                     },
                     {
                       "params": [],
                       "type": "mean"
                     }
                   ]
                 ],
                 "tags": []
               },
               {
                 "alias": "Heizung",
                 "groupBy": [
                   {
                     "params": [
                       "$__interval"
                     ],
                     "type": "time"
                   },
                   {
                     "params": [
                       "null"
                     ],
                     "type": "fill"
                   }
                 ],
                 "measurement": "sourceanalytix.0.wiffi-wz__0__root__10_1_30_10__w_counter_2.cost.03_current_month",
                 "orderByTime": "ASC",
                 "policy": "default",
                 "refId": "B",
                 "resultFormat": "time_series",
                 "select": [
                   [
                     {
                       "params": [
                         "value"
                       ],
                       "type": "field"
                     },
                     {
                       "params": [],
                       "type": "mean"
                     }
                   ]
                 ],
                 "tags": []
               },
               {
                 "alias": "Wasser",
                 "groupBy": [
                   {
                     "params": [
                       "$__interval"
                     ],
                     "type": "time"
                   },
                   {
                     "params": [
                       "null"
                     ],
                     "type": "fill"
                   }
                 ],
                 "measurement": "sourceanalytix.0.wiffi-wz__0__root__10_1_30_10__w_counter_3.cost.03_current_month",
                 "orderByTime": "ASC",
                 "policy": "default",
                 "refId": "C",
                 "resultFormat": "time_series",
                 "select": [
                   [
                     {
                       "params": [
                         "value"
                       ],
                       "type": "field"
                     },
                     {
                       "params": [],
                       "type": "mean"
                     }
                   ]
                 ],
                 "tags": []
               }
             ],
             "timeFrom": null,
             "timeShift": null,
             "title": "Pie Chart",
             "transparent": true,
             "type": "grafana-piechart-panel",
             "valueName": "current"
           }
         ],
         "schemaVersion": 21,
         "style": "dark",
         "tags": [
           "Monatsverbrauch"
         ],
         "templating": {
           "list": []
         },
         "time": {
           "from": "now/M",
           "to": "now"
         },
         "timepicker": {
           "refresh_intervals": [
             "5s",
             "10s",
             "30s",
             "1m",
             "5m",
             "15m",
             "30m",
             "1h",
             "2h",
             "1d"
           ],
           "time_options": [
             "5m",
             "15m",
             "1h",
             "6h",
             "12h",
             "24h",
             "2d",
             "7d",
             "30d"
           ]
         },
         "timezone": "",
         "title": "Monatsverbrauch",
         "uid": "_tteA1VZz",
         "version": 73
        }
        

        Negalein 1 Reply Last reply Reply Quote 0
        • Negalein
          Negalein Global Moderator @crunchip last edited by Negalein

          @crunchip sagte in Grafana Tagesverbrauch:

          mach mal ein neues dasboard füge die json ein...und natürlich deinen Datenpunkt anpassen

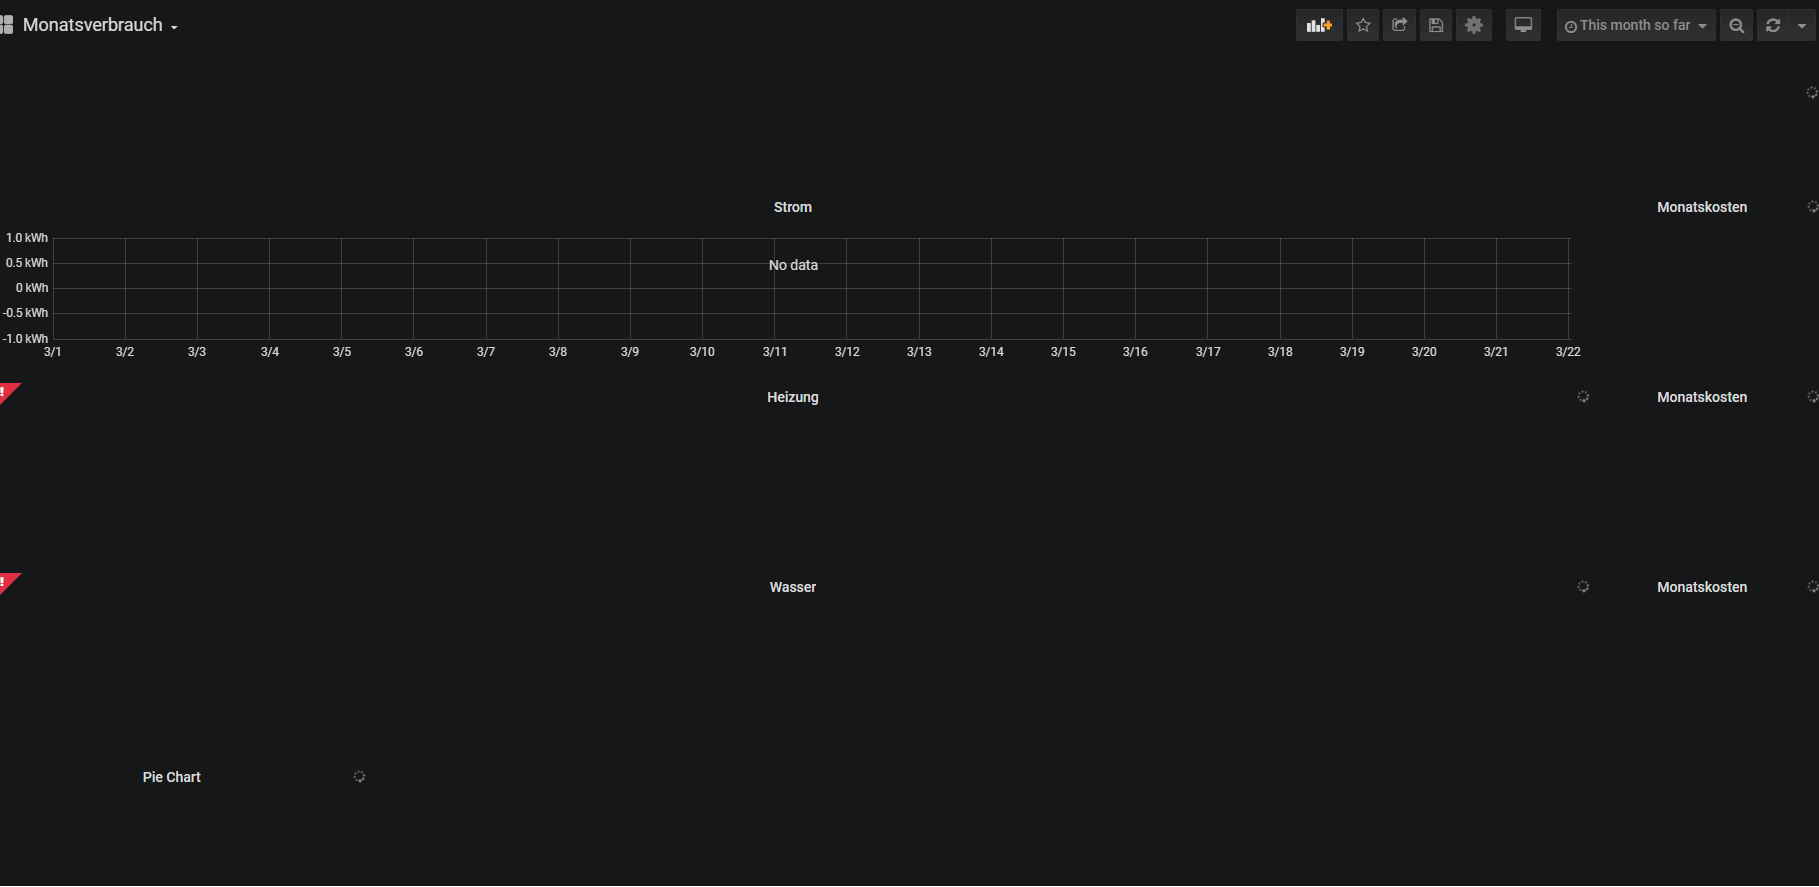
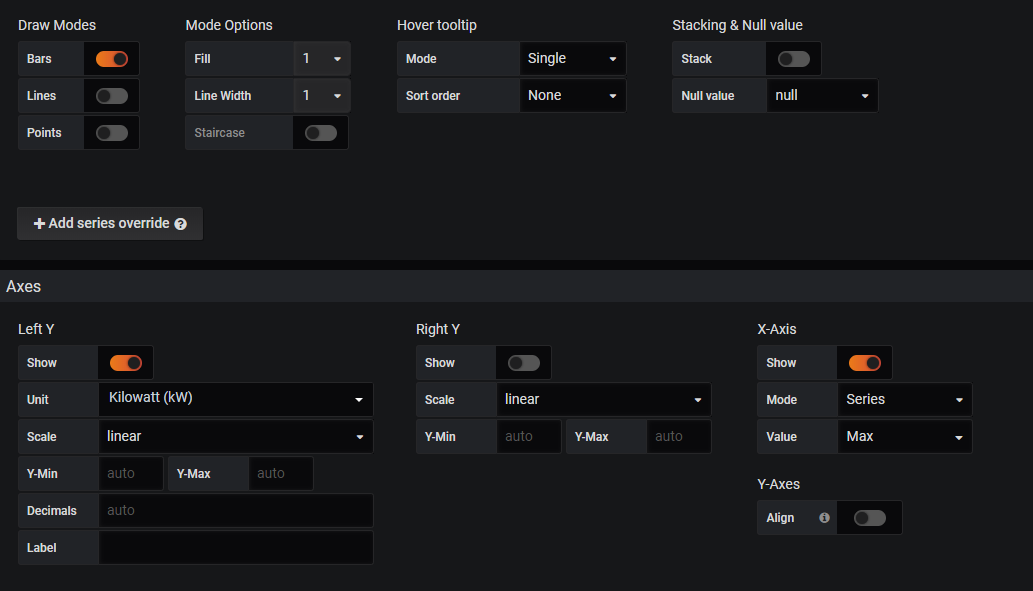
          kommt auch "no Data"
          Monatsverbrauch - Grafana.png
          Monatsverbrauch - Grafana (1).png

          crunchip 1 Reply Last reply Reply Quote 0
          • crunchip
            crunchip Forum Testing Most Active @Negalein last edited by

            @Negalein auch die richtige Datenbank ausgewählt? oder hast du nur eine

            Negalein 1 Reply Last reply Reply Quote 0
            • Negalein
              Negalein Global Moderator @crunchip last edited by

              @crunchip sagte in Grafana Tagesverbrauch:

              auch die richtige Datenbank ausgewählt? oder hast du nur eine

              Ja, hab nur eine

              1 Reply Last reply Reply Quote 0
              • Negalein
                Negalein Global Moderator last edited by

                wähle ich "nur" den DP als Query aus, kommen Daten.

                Verwende ich aber
                SELECT non_negative_difference(last(cumulative_sum))FROM ( SELECT cumulative_sum(non_negative_difference(last("value"))) FROM "sourceanalytix.0.hs100__0__10_0_1_80__power.Meter_Readings.Current_Reading" WHERE $timeFilter GROUP BY time(1d) ) WHERE $timeFilter GROUP BY time(1d) tz('Europe/Berlin')
                kommt "no Data".

                crunchip 1 Reply Last reply Reply Quote 0
                • crunchip
                  crunchip Forum Testing Most Active @Negalein last edited by crunchip

                  @Negalein klick mal rechts auf Query Inspector >>Expand All
                  vllt kann man da etwas erkennen
                  45591baf-0646-4e80-9edf-aec81ab5acb5-image.png

                  Negalein 1 Reply Last reply Reply Quote 0
                  • Negalein
                    Negalein Global Moderator @crunchip last edited by

                    @crunchip sagte in Grafana Tagesverbrauch:

                    klick mal rechts auf Query Inspector >>Expand All

                    Object
                    xhrStatus:"complete"
                    request:Object
                    method:"GET"
                    url:"api/datasources/proxy/1/query"
                    params:Object
                    db:"iobroker"
                    q:"SELECT non_negative_difference(last(cumulative_sum))FROM ( SELECT cumulative_sum(non_negative_difference(last("value"))) FROM "sourceanalytix.0.hs100__0__10_0_1_80__power.Meter_Readings.Current_Reading" WHERE time >= 1583017200000ms GROUP BY time(1d) ) WHERE time >= 1583017200000ms GROUP BY time(1d) tz('Europe/Berlin')"
                    epoch:"ms"
                    data:null
                    precision:"ms"
                    response:Object
                    results:Array[1]
                    0:Object
                    statement_id:0
                    
                    crunchip 1 Reply Last reply Reply Quote 0
                    • crunchip
                      crunchip Forum Testing Most Active @Negalein last edited by

                      @Negalein mehr kommt da nicht?

                      Negalein 2 Replies Last reply Reply Quote 0
                      • Negalein
                        Negalein Global Moderator @crunchip last edited by

                        @crunchip sagte in Grafana Tagesverbrauch:

                        mehr kommt da nicht?

                        Nein, ist alles

                        crunchip 1 Reply Last reply Reply Quote 0
                        • Negalein
                          Negalein Global Moderator @crunchip last edited by

                          @crunchip sagte in Grafana Tagesverbrauch:

                          mehr kommt da nicht?

                          verwende ich nur den DP im Query kommt viel mehr.
                          new 11.txt

                          1 Reply Last reply Reply Quote 0
                          • crunchip
                            crunchip Forum Testing Most Active @Negalein last edited by crunchip

                            @Negalein ich würde mal sagen du musst noch nen Tag warten 🤦‍♀️
                            was soll denn auch berechnet werden, wenn erst ein 1 Wert vorhanden ist...wenn ma es logisch betrachtet

                            dieser Part kann ja erst am folgeTag errechnet werden GROUP BY time(1d)

                            SELECT non_negative_difference(last(cumulative_sum))FROM (
                            SELECT cumulative_sum(non_negative_difference(last("value")))
                            
                            Negalein 1 Reply Last reply Reply Quote 0
                            • Negalein
                              Negalein Global Moderator @crunchip last edited by

                              @crunchip sagte in Grafana Tagesverbrauch:

                              ich würde mal sagen du musst noch nen Tag warten
                              was soll denn auch berechnet werden, wenn erst ein 1 Wert vorhanden ist...wenn ma es logisch betrachtet
                              dieser Part kann ja erst am folgeTag errechnet werden

                              Ah, ok. Also warte ich mal bis morgen.
                              Dachte, da ich es schon vor Mitternacht aktiviert habe, funktioniert es schon nach Mitternacht .

                              crunchip 1 Reply Last reply Reply Quote 0
                              • crunchip
                                crunchip Forum Testing Most Active @Negalein last edited by

                                @Negalein na da hatte ich jetzt auch nicht dran gedacht...warte mal noch nen Tag ab, dann sollte da auch was erscheinen

                                Negalein 1 Reply Last reply Reply Quote 0
                                • Negalein
                                  Negalein Global Moderator @crunchip last edited by

                                  @crunchip sagte in Grafana Tagesverbrauch:

                                  na da hatte ich jetzt auch nicht dran gedacht

                                  kein Problem

                                  warte mal noch nen Tag ab, dann sollte da auch was erscheinen

                                  Ich melde mich wieder 🙂

                                  1 Reply Last reply Reply Quote 1
                                  • Negalein
                                    Negalein Global Moderator last edited by

                                    @crunchip

                                    neuer Tag, leider kein neues Glück.

                                    Steht noch immer "no Data".

                                    Ich versuch es jetzt mal mit diesen DP aus Source (für jeden Tag ein Query).
                                    Mal schaun, ob die Balken dann nebeneinander liegen.

                                    objects - ioBroker (11).png

                                    crunchip 1 Reply Last reply Reply Quote 0
                                    • crunchip
                                      crunchip Forum Testing Most Active @Negalein last edited by

                                      @Negalein seltsam, sollte normalerweise funktionieren

                                      ja wenn du die einzelnen, pro Tag loggst, geht es auf jeden Fall....aber sollte ja auch anders funktionieren

                                      Negalein 1 Reply Last reply Reply Quote 0
                                      • Negalein
                                        Negalein Global Moderator @crunchip last edited by

                                        @crunchip sagte in Grafana Tagesverbrauch:

                                        seltsam, sollte normalerweise funktionieren
                                        ja wenn du die einzelnen, pro Tag loggst, geht es auf jeden Fall....aber sollte ja auch anders funktionieren

                                        Ja, ist komisch.

                                        Die Beispiele, die ich im Netz gefunden habe, zielten auch alle auf deinen Weg hin.

                                        So schauts jetzt mal aus.

                                        New dashboard - Grafana (2).png
                                        New dashboard - Grafana (3).png

                                        crunchip 1 Reply Last reply Reply Quote 0
                                        • crunchip
                                          crunchip Forum Testing Most Active @Negalein last edited by

                                          @Negalein ist doch schon mal was
                                          hast du es nochmal mit dem json vom ganzen dashboard getestet, das ich gestern reingestellt hatte

                                          Negalein 2 Replies Last reply Reply Quote 0
                                          • Negalein
                                            Negalein Global Moderator @crunchip last edited by

                                            @crunchip sagte in Grafana Tagesverbrauch:

                                            hast du es nochmal mit dem json vom ganzen dashboard getestet, das ich gestern reingestellt hatte

                                            Stimmt, das teste ich gleich

                                            1 Reply Last reply Reply Quote 0
                                            • First post
                                              Last post

                                            Support us

                                            ioBroker
                                            Community Adapters
                                            Donate

                                            837
                                            Online

                                            31.7k
                                            Users

                                            79.7k
                                            Topics

                                            1.3m
                                            Posts

                                            how-to
                                            8
                                            55
                                            16794
                                            Loading More Posts
                                            • Oldest to Newest
                                            • Newest to Oldest
                                            • Most Votes
                                            Reply
                                            • Reply as topic
                                            Log in to reply
                                            Community
                                            Impressum | Datenschutz-Bestimmungen | Nutzungsbedingungen
                                            The ioBroker Community 2014-2023
                                            logo