Material Design Widgets: JSON Chart Widget
-
V0.3.0
Adapter: TankerkönigIch hab nur einen Ladekreis wenn ich einen JSON DP hinterlege
-
Hallo.
Ich bin noch in der Anfangsphase was das alles hier betrifft.
Ich bin auch recht unwissend was JAVA betrifft und klicke mich mehr durch Blockly daher scheinen deine Widgets sehr Interessant zu sein.Das was ich jetzt nirgendwo gefunden habe ist wie ich Daten in das JSON Chart Widget rein bekomme.
Gehe einfach einmal davon aus das ich total unwissend bin.
Ich habe mir selber über Blockly einen JSON Datensatz erzeugt.
Welches Format muss das JSON haben um Angezeigt zu werden.
Mein Datensatz enthält
[{"Zeitstempel":"1586556000000","Wert":"15","Uhrzeit":"00:00"},{"Zeitstempel":"1586556060000","Wert":"15","Uhrzeit":"00:01"},{"Zeitstempel":"1586556120000","Wert":"15","Uhrzeit":"00:02"},{"Zeitstempel":"1586556180000","Wert":"15","Uhrzeit":"00:03"},{"Zeitstempel":"1586556240000","Wert":"15","Uhrzeit":"00:04"},"
.
.
.
{"Zeitstempel":"1586642040000","Wert":"1434","Uhrzeit":"23:54"},{"Zeitstempel":"1586642100000","Wert":"1435","Uhrzeit":"23:55"},{"Zeitstempel":"1586642160000","Wert":"1436","Uhrzeit":"23:56"},{"Zeitstempel":"1586642220000","Wert":"1437","Uhrzeit":"23:57"},{"Zeitstempel":"1586642280000","Wert":"1438","Uhrzeit":"23:58"},{"Zeitstempel":"1586642340000","Wert":"1439","Uhrzeit":"23:59"},{"Zeitstempel":"1586642400000","Wert":"1440","Uhrzeit":"00:00"}]Wie bekomme ich diese Werte angezeigt und wie kann ich auswählen was angezeigt wird.
In diesem Fall möchte ich die Werte in Abhängigkeit von der Uhrzeit angezeigt bekommen.
Ist dieses möglich oder denke ich einfach nur Falsch.
Irgendwo muss ich doch angeben was Angezeigt werden soll.
Danke schon einmal für eine mögliche Erklärung.
Andreas
-
@Meistertr sagte in Material Design Widgets: JSON Chart Widget:
@Scrounger sehr cool. kannst du mir das Beispiel aud dem bild geben
Beispiel in dem es enthalten ist findest du hier:
https://forum.iobroker.net/topic/32232/material-design-widgets-wetter-view -
ich habe leider das gleiche Problem wie @Stephan-Schleich
Ich wollte mir den UV Index vom OpenUV Adapter auslesen und habe versucht das Script von dir anzupassen.
Anpassungen erfolgten in folgenden Zeilen:
7
22
28
19
24-31
39Die Daten sollen aus folgenden Datenpunkt vom History Adapter geholt werden:
"openuv.0.UV"Folgendes Json wird geschrieben:
{"graphs":[{"type":"linie","color":"#FF8C00","legendText":"UV-Index","yAxis_id":0,"line_UseFillColor":true,"displayOrder":0,"line_Thickness":2,"line_pointSize":0,"datalabel_show":false,"yAxis_min":0,"yAxis_max":15,"yAxis_zeroLineWidth":0,"xAxis_bounds":"ticks","xAxis_timeFormats":{"millisecond":"H:mm:ss.SSS","second":"H:mm:ss","minute":"H:mm","hour":"dd.[\\n]H:mm","day":"dd[\\n]DD.MM","week":"dd[\\n]DD.MM","month":"MMM[\\n]YYYY","quarter":"[Q]Q - YYYY","year":"YYYY"},"data":[{"t":1586556000000,"y":null},{"t":1586572168731,"y":0.7257},{"t":1586604506194,"y":0},{"t":1586636843656,"y":0},{"t":1586669181118,"y":4.5307},{"t":1586701518581,"y":5.5938},{"t":1586733856043,"y":0},{"t":1586766193505,"y":5.5113},{"t":1586798530968,"y":4.6673},{"t":1586830868430,"y":0.6749},{"t":1586863205892,"y":5.7168},{"t":1586895543355,"y":0.8337},{"t":1586927880817,"y":4.325},{"t":1586960218279,"y":5.555},{"t":1586992555742,"y":0},{"t":1587024893204,"y":5.8891},{"t":1587057230666,"y":4.8084},{"t":1587089568129,"y":0.6144},{"t":1587121905591,"y":5.341},{"t":1587154243053,"y":0.8423},{"t":1587186580516,"y":4.1001}]}]}Die bisherige Darstellung erfolgte über Flot Diagramme
Wo mache ich hier bitte den Fehler?
Datenpunkte lassen auch nur unter userdata anlegen.
-
@Atredis sagte in Material Design Widgets: JSON Chart Widget:
Welches Format muss das JSON haben um Angezeigt zu werden.
steht in der Doku:
https://github.com/Scrounger/ioBroker.vis-materialdesign#json-chartSchau dir die Beispiele an:
https://forum.iobroker.net/topic/26925/test-adapter-material-design-widgets-v0-2-x/857@Stephan-Schleich sagte in Material Design Widgets: JSON Chart Widget:
Ich hab nur einen Ladekreis wenn ich einen JSON DP hinterlege
@Oli sagte in Material Design Widgets: JSON Chart Widget:
ich habe leider das gleiche Problem wie @Stephan-Schleich
Benötige den json string und die skripte, damit ich weiterhelfen kann.
-
danke schon mal im Voraus, das Script ist bereits im Spoiler vorhanden.
Was meinst du mit json string?
-
@Oli
Habs nur halb gelesen")
Alle Infos da, schaus mir an. -
danke
-
@Oli
axislabel fehltEdit:
Oh sollte echt mal richtig lesen. Du verwendest timestamps für die x-achse.Hast nen tipp fehler:
"type": "linie",muss
"type": "line",Das steht auch in der console log, wenn man den debug modus aktiviert hat.
-
super, danke funktioniert
-
hast du auch mal nach dem 2 Thema aus meinem Poste geschaut?
Wenn ich im Script Zeile 7
let strukturChannel = '0_userdata.0.Wetter.Diagramme.UvIndex';"0_userdata.0.Wetter.Diagramme.UvIndex" gegen "javascript.0.Wetter.Diagramme.UvIndex" tausche bringt er mir folgende Warnungen und die Datenpunkte werden nicht angelegt
javascript.0 2020-04-18 13:25:55.275 warn (5564) at process._tickCallback (internal/process/next_tick.js:68:7) javascript.0 2020-04-18 13:25:55.275 warn (5564) at Promise.all.then (script.js.Diagramme.Diagramm_Test:97:21) javascript.0 2020-04-18 13:25:55.275 warn (5564) at mySetState (script.js.Diagramme.Diagramm_Test:206:9) javascript.0 2020-04-18 13:25:55.275 warn (5564) at createUserStates (script.js.Diagramme.Diagramm_Test:284:24) javascript.0 2020-04-18 13:25:55.274 warn (5564) at Array.forEach (<anonymous>:null:null) javascript.0 2020-04-18 13:25:55.274 warn (5564) at script.js.Diagramme.Diagramm_Test:299:36 javascript.0 2020-04-18 13:25:55.274 warn (5564) at script.js.Diagramme.Diagramm_Test:214:13 javascript.0 2020-04-18 13:25:55.274 warn (5564) at setState (/opt/iobroker/node_modules/iobroker.javascript/lib/sandbox.js:1404:20) javascript.0 2020-04-18 13:25:55.273 warn (5564) State "javascript.0.Wetter.Diagramme.UvIndex.UvIndex" not found -
@Oli
Edit:
Ok Frage betrifft Wigdet aber auch nciht, sondern ist eine Frage bzgl. skripts:Es wird in dem Beispiel nur
'0_userdata.0'unterstützt, weil es in zeile 235 hard coded ist:const where = '0_userdata.0' -
Ich hab mal ne Frage...
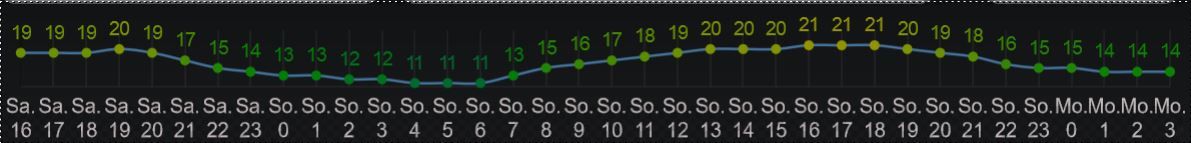
Nach nem Update von Node und NPM und einiger npm module (ich glaube "moment" war auch mit dabei) hat sich mein "Wettertrend" von ehemals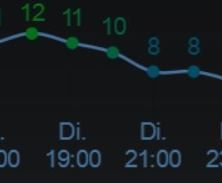
nach
geändert.
Der Tooltip ist jetzt auch leer...
Das Javascript, das den JSON erstellt wurde nicht geändert.
und nun die Frage: "Warum ist das so?"

Das ist der JSON
{"graphs":[{"data":[{"t":1591455600000,"y":17},{"t":1591459200000,"y":17},{"t":1591462800000,"y":16},{"t":1591466400000,"y":16},{"t":1591470000000,"y":15},{"t":1591473600000,"y":14},{"t":1591477200000,"y":13},{"t":1591480800000,"y":13},{"t":1591484400000,"y":12},{"t":1591488000000,"y":12},{"t":1591491600000,"y":12},{"t":1591495200000,"y":12},{"t":1591498800000,"y":12},{"t":1591502400000,"y":12},{"t":1591506000000,"y":12},{"t":1591509600000,"y":12},{"t":1591513200000,"y":12},{"t":1591516800000,"y":12},{"t":1591520400000,"y":12},{"t":1591524000000,"y":12},{"t":1591527600000,"y":12},{"t":1591531200000,"y":13},{"t":1591534800000,"y":13},{"t":1591538400000,"y":13},{"t":1591542000000,"y":14},{"t":1591545600000,"y":14},{"t":1591549200000,"y":14},{"t":1591552800000,"y":13},{"t":1591556400000,"y":12},{"t":1591560000000,"y":12},{"t":1591563600000,"y":11},{"t":1591567200000,"y":10},{"t":1591570800000,"y":10},{"t":1591574400000,"y":9},{"t":1591578000000,"y":9},{"t":1591581600000,"y":8}],"type":"line","legendText":"Temperatur","tooltip_text":"Temperatur","tooltip_MaxDigits":1,"tooltip_AppendText":" °C","datalabel_color":["#468a00","#468a00","#338700","#338700","#208500","#0d8200","#007d06","#007d06","#00731a","#00731a","#00731a","#00731a","#00731a","#00731a","#00731a","#00731a","#00731a","#00731a","#00731a","#00731a","#00731a","#007d06","#007d06","#007d06","#0d8200","#0d8200","#0d8200","#007d06","#00731a","#00731a","#006a2d","#006040","#006040","#005653","#005653","#004d66"],"line_PointColor":["#468a00","#468a00","#338700","#338700","#208500","#0d8200","#007d06","#007d06","#00731a","#00731a","#00731a","#00731a","#00731a","#00731a","#00731a","#00731a","#00731a","#00731a","#00731a","#00731a","#00731a","#007d06","#007d06","#007d06","#0d8200","#0d8200","#0d8200","#007d06","#00731a","#00731a","#006a2d","#006040","#006040","#005653","#005653","#004d66"],"line_PointColorBorder":["#468a00","#468a00","#338700","#338700","#208500","#0d8200","#007d06","#007d06","#00731a","#00731a","#00731a","#00731a","#00731a","#00731a","#00731a","#00731a","#00731a","#00731a","#00731a","#00731a","#00731a","#007d06","#007d06","#007d06","#0d8200","#0d8200","#0d8200","#007d06","#00731a","#00731a","#006a2d","#006040","#006040","#005653","#005653","#004d66"],"yAxis_show":"false","yAxis_appendix":" °C","xAxis_timeFormats":{"millisecond":"H:mm:ss.SSS","second":"H:mm:ss","minute":"H:mm","hour":"dd.[\\n]H:mm","day":"dd[\\n]DD.MM","week":"dd[\\n]DD.MM","month":"MMM[\\n]YYYY","quarter":"[Q]Q - YYYY","year":"YYYY"}}]}Und das Debug-LOG
JSON Chart w00114] widget setting: {"_data":{"wid":"w00114","oid":"javascript.0.vorhersage.json","g_fixed":true,"g_visibility":false,"g_css_font_text":true,"g_css_background":false,"g_css_shadow_padding":false,"g_css_border":false,"g_gestures":false,"g_signals":false,"g_last_change":false,"visibility-cond":"==","visibility-val":1,"visibility-groups-action":"hide","chartType":"line","showLegend":false,"legendPosition":"right","legendPointStyle":"true","showTooltip":"true","tooltipMode":"nearest","tooltipShowColorBox":true,"xAxisPosition":"bottom","xAxisValueDistanceToAxis":"","xAxisShowAxis":true,"xAxisShowAxisLabels":true,"xAxisShowGridLines":"true","xAxisShowTicks":"true","xAxisMinRotation":"0","xAxisMaxRotation":"0","yAxisValueDistanceToAxis":"10","signals-cond-0":"==","signals-val-0":true,"signals-icon-0":"/vis/signals/lowbattery.png","signals-icon-size-0":0,"signals-blink-0":false,"signals-horz-0":0,"signals-vert-0":0,"signals-hide-edit-0":false,"signals-cond-1":"==","signals-val-1":true,"signals-icon-1":"/vis/signals/lowbattery.png","signals-icon-size-1":0,"signals-blink-1":false,"signals-horz-1":0,"signals-vert-1":0,"signals-hide-edit-1":false,"signals-cond-2":"==","signals-val-2":true,"signals-icon-2":"/vis/signals/lowbattery.png","signals-icon-size-2":0,"signals-blink-2":false,"signals-horz-2":0,"signals-vert-2":0,"signals-hide-edit-2":false,"lc-type":"last-change","lc-is-interval":true,"lc-is-moment":false,"lc-format":"","lc-position-vert":"top","lc-position-horz":"right","lc-offset-vert":0,"lc-offset-horz":0,"lc-font-size":"12px","lc-font-family":"","lc-font-style":"","lc-bkg-color":"","lc-color":"","lc-border-width":"0","lc-border-style":"","lc-border-color":"","lc-border-radius":10,"lc-zindex":0,"mdwDebug":true,"chartPaddingTop":"20","name":"WetterTrend","legendFontColor":"","xAxisValueLabelColor":"#c3bbbb","xAxisGridLinesColor":"#c3bbbb","axisLabelAutoSkip":false,"xAxisValueFontSize":"","xAxisMaxLabel":"","xAxisTitle":"","xAxisOffsetGridLines":false,"tooltipBodyAppend":""},"_cid":".map102","_computedAttrs":{},"wid":"w00114","oid":"javascript.0.vorhersage.json","g_fixed":true,"g_visibility":false,"g_css_font_text":true,"g_css_background":false,"g_css_shadow_padding":false,"g_css_border":false,"g_gestures":false,"g_signals":false,"g_last_change":false,"visibility-cond":"==","visibility-val":1,"visibility-groups-action":"hide","chartType":"line","showLegend":false,"legendPosition":"right","legendPointStyle":"true","showTooltip":"true","tooltipMode":"nearest","tooltipShowColorBox":true,"xAxisPosition":"bottom","xAxisValueDistanceToAxis":"","xAxisShowAxis":true,"xAxisShowAxisLabels":true,"xAxisShowGridLines":"true","xAxisShowTicks":"true","xAxisMinRotation":"0","xAxisMaxRotation":"0","yAxisValueDistanceToAxis":"10","signals-cond-0":"==","signals-val-0":true,"signals-icon-0":"/vis/signals/lowbattery.png","signals-icon-size-0":0,"signals-blink-0":false,"signals-horz-0":0,"signals-vert-0":0,"signals-hide-edit-0":false,"signals-cond-1":"==","signals-val-1":true,"signals-icon-1":"/vis/signals/lowbattery.png","signals-icon-size-1":0,"signals-blink-1":false,"signals-horz-1":0,"signals-vert-1":0,"signals-hide-edit-1":false,"signals-cond-2":"==","signals-val-2":true,"signals-icon-2":"/vis/signals/lowbattery.png","signals-icon-size-2":0,"signals-blink-2":false,"signals-horz-2":0,"signals-vert-2":0,"signals-hide-edit-2":false,"lc-type":"last-change","lc-is-interval":true,"lc-is-moment":false,"lc-format":"","lc-position-vert":"top","lc-position-horz":"right","lc-offset-vert":0,"lc-offset-horz":0,"lc-font-size":"12px","lc-font-family":"","lc-font-style":"","lc-bkg-color":"","lc-color":"","lc-border-width":"0","lc-border-style":"","lc-border-color":"","lc-border-radius":10,"lc-zindex":0,"mdwDebug":true,"chartPaddingTop":"20","name":"WetterTrend","legendFontColor":"","xAxisValueLabelColor":"#c3bbbb","xAxisGridLinesColor":"#c3bbbb","axisLabelAutoSkip":false,"xAxisValueFontSize":"","xAxisMaxLabel":"","xAxisTitle":"","xAxisOffsetGridLines":false,"tooltipBodyAppend":"","_bubbleBindings":{},"__bindEvents":{"class":[{"name":"class"}],"backgroundColor":[{"name":"backgroundColor"}],"wid":[{"name":"wid"}]},"_bindings":3} instrument.ts:129:69
[JSON Chart w00114] json: {"graphs":[{"data":[{"t":1591455600000,"y":17},{"t":1591459200000,"y":17},{"t":1591462800000,"y":16},{"t":1591466400000,"y":16},{"t":1591470000000,"y":15},{"t":1591473600000,"y":14},{"t":1591477200000,"y":13},{"t":1591480800000,"y":13},{"t":1591484400000,"y":12},{"t":1591488000000,"y":12},{"t":1591491600000,"y":12},{"t":1591495200000,"y":12},{"t":1591498800000,"y":12},{"t":1591502400000,"y":12},{"t":1591506000000,"y":12},{"t":1591509600000,"y":12},{"t":1591513200000,"y":12},{"t":1591516800000,"y":12},{"t":1591520400000,"y":12},{"t":1591524000000,"y":12},{"t":1591527600000,"y":12},{"t":1591531200000,"y":13},{"t":1591534800000,"y":13},{"t":1591538400000,"y":13},{"t":1591542000000,"y":14},{"t":1591545600000,"y":14},{"t":1591549200000,"y":14},{"t":1591552800000,"y":13},{"t":1591556400000,"y":12},{"t":1591560000000,"y":12},{"t":1591563600000,"y":11},{"t":1591567200000,"y":10},{"t":1591570800000,"y":10},{"t":1591574400000,"y":9},{"t":1591578000000,"y":9},{"t":1591581600000,"y":8}],"type":"line","legendText":"Temperatur","tooltip_text":"Temperatur","tooltip_MaxDigits":1,"tooltip_AppendText":" °C","datalabel_color":["#468a00","#468a00","#338700","#338700","#208500","#0d8200","#007d06","#007d06","#00731a","#00731a","#00731a","#00731a","#00731a","#00731a","#00731a","#00731a","#00731a","#00731a","#00731a","#00731a","#00731a","#007d06","#007d06","#007d06","#0d8200","#0d8200","#0d8200","#007d06","#00731a","#00731a","#006a2d","#006040","#006040","#005653","#005653","#004d66"],"line_PointColor":["#468a00","#468a00","#338700","#338700","#208500","#0d8200","#007d06","#007d06","#00731a","#00731a","#00731a","#00731a","#00731a","#00731a","#00731a","#00731a","#00731a","#00731a","#00731a","#00731a","#00731a","#007d06","#007d06","#007d06","#0d8200","#0d8200","#0d8200","#007d06","#00731a","#00731a","#006a2d","#006040","#006040","#005653","#005653","#004d66"],"line_PointColorBorder":["#468a00","#468a00","#338700","#338700","#208500","#0d8200","#007d06","#007d06","#00731a","#00731a","#00731a","#00731a","#00731a","#00731a","#00731a","#00731a","#00731a","#00731a","#00731a","#00731a","#00731a","#007d06","#007d06","#007d06","#0d8200","#0d8200","#0d8200","#007d06","#00731a","#00731a","#006a2d","#006040","#006040","#005653","#005653","#004d66"],"yAxis_show":"false","yAxis_appendix":" °C","xAxis_timeFormats":{"millisecond":"H:mm:ss.SSS","second":"H:mm:ss","minute":"H:mm","hour":"dd.[\\n]H:mm","day":"dd[\\n]DD.MM","week":"dd[\\n]DD.MM","month":"MMM[\\n]YYYY","quarter":"[Q]Q - YYYY","year":"YYYY"}}]} instrument.ts:129:69
[JSON Chart w00114] graph[0]: {"data":[{"t":1591455600000,"y":17},{"t":1591459200000,"y":17},{"t":1591462800000,"y":16},{"t":1591466400000,"y":16},{"t":1591470000000,"y":15},{"t":1591473600000,"y":14},{"t":1591477200000,"y":13},{"t":1591480800000,"y":13},{"t":1591484400000,"y":12},{"t":1591488000000,"y":12},{"t":1591491600000,"y":12},{"t":1591495200000,"y":12},{"t":1591498800000,"y":12},{"t":1591502400000,"y":12},{"t":1591506000000,"y":12},{"t":1591509600000,"y":12},{"t":1591513200000,"y":12},{"t":1591516800000,"y":12},{"t":1591520400000,"y":12},{"t":1591524000000,"y":12},{"t":1591527600000,"y":12},{"t":1591531200000,"y":13},{"t":1591534800000,"y":13},{"t":1591538400000,"y":13},{"t":1591542000000,"y":14},{"t":1591545600000,"y":14},{"t":1591549200000,"y":14},{"t":1591552800000,"y":13},{"t":1591556400000,"y":12},{"t":1591560000000,"y":12},{"t":1591563600000,"y":11},{"t":1591567200000,"y":10},{"t":1591570800000,"y":10},{"t":1591574400000,"y":9},{"t":1591578000000,"y":9},{"t":1591581600000,"y":8}],"type":"line","legendText":"Temperatur","tooltip_text":"Temperatur","tooltip_MaxDigits":1,"tooltip_AppendText":" °C","datalabel_color":["#468a00","#468a00","#338700","#338700","#208500","#0d8200","#007d06","#007d06","#00731a","#00731a","#00731a","#00731a","#00731a","#00731a","#00731a","#00731a","#00731a","#00731a","#00731a","#00731a","#00731a","#007d06","#007d06","#007d06","#0d8200","#0d8200","#0d8200","#007d06","#00731a","#00731a","#006a2d","#006040","#006040","#005653","#005653","#004d66"],"line_PointColor":["#468a00","#468a00","#338700","#338700","#208500","#0d8200","#007d06","#007d06","#00731a","#00731a","#00731a","#00731a","#00731a","#00731a","#00731a","#00731a","#00731a","#00731a","#00731a","#00731a","#00731a","#007d06","#007d06","#007d06","#0d8200","#0d8200","#0d8200","#007d06","#00731a","#00731a","#006a2d","#006040","#006040","#005653","#005653","#004d66"],"line_PointColorBorder":["#468a00","#468a00","#338700","#338700","#208500","#0d8200","#007d06","#007d06","#00731a","#00731a","#00731a","#00731a","#00731a","#00731a","#00731a","#00731a","#00731a","#00731a","#00731a","#00731a","#00731a","#007d06","#007d06","#007d06","#0d8200","#0d8200","#0d8200","#007d06","#00731a","#00731a","#006a2d","#006040","#006040","#005653","#005653","#004d66"],"yAxis_show":"false","yAxis_appendix":" °C","xAxis_timeFormats":{"millisecond":"H:mm:ss.SSS","second":"H:mm:ss","minute":"H:mm","hour":"dd.[\\n]H:mm","day":"dd[\\n]DD.MM","week":"dd[\\n]DD.MM","month":"MMM[\\n]YYYY","quarter":"[Q]Q - YYYY","year":"YYYY"}} instrument.ts:129:69
[JSON Chart w00114] graph[0].data is data object -> using time axis instrument.ts:129:69
[JSON Chart w00114] graph[0].data length: 36 instrument.ts:129:69
[JSON Chart w00114] mydata: {"labels":[],"datasets":[{"data":[{"t":1591455600000,"y":17},{"t":1591459200000,"y":17},{"t":1591462800000,"y":16},{"t":1591466400000,"y":16},{"t":1591470000000,"y":15},{"t":1591473600000,"y":14},{"t":1591477200000,"y":13},{"t":1591480800000,"y":13},{"t":1591484400000,"y":12},{"t":1591488000000,"y":12},{"t":1591491600000,"y":12},{"t":1591495200000,"y":12},{"t":1591498800000,"y":12},{"t":1591502400000,"y":12},{"t":1591506000000,"y":12},{"t":1591509600000,"y":12},{"t":1591513200000,"y":12},{"t":1591516800000,"y":12},{"t":1591520400000,"y":12},{"t":1591524000000,"y":12},{"t":1591527600000,"y":12},{"t":1591531200000,"y":13},{"t":1591534800000,"y":13},{"t":1591538400000,"y":13},{"t":1591542000000,"y":14},{"t":1591545600000,"y":14},{"t":1591549200000,"y":14},{"t":1591552800000,"y":13},{"t":1591556400000,"y":12},{"t":1591560000000,"y":12},{"t":1591563600000,"y":11},{"t":1591567200000,"y":10},{"t":1591570800000,"y":10},{"t":1591574400000,"y":9},{"t":1591578000000,"y":9},{"t":1591581600000,"y":8}],"label":"Temperatur","type":"line","order":"0","yAxisID":"yAxis_id_0","datalabels":{"display":true,"anchor":"end","align":"top","textAlign":"center","offset":0,"clamp":true,"font":{},"color":["#468a00","#468a00","#338700","#338700","#208500","#0d8200","#007d06","#007d06","#00731a","#00731a","#00731a","#00731a","#00731a","#00731a","#00731a","#00731a","#00731a","#00731a","#00731a","#00731a","#00731a","#007d06","#007d06","#007d06","#0d8200","#0d8200","#0d8200","#007d06","#00731a","#00731a","#006a2d","#006040","#006040","#005653","#005653","#004d66"],"borderWidth":0,"borderRadius":0},"myGradientColors":{"useGradientColor":false,"gradientColors":"#44739e","useGradientFillColor":false,"gradientFillColors":"#44739e33"},"borderColor":"#44739e","steppedLine":false,"pointStyle":"circle","pointRadius":3,"pointHoverRadius":4,"pointBackgroundColor":["#468a00","#468a00","#338700","#338700","#208500","#0d8200","#007d06","#007d06","#00731a","#00731a","#00731a","#00731a","#00731a","#00731a","#00731a","#00731a","#00731a","#00731a","#00731a","#00731a","#00731a","#007d06","#007d06","#007d06","#0d8200","#0d8200","#0d8200","#007d06","#00731a","#00731a","#006a2d","#006040","#006040","#005653","#005653","#004d66"],"pointBorderColor":["#468a00","#468a00","#338700","#338700","#208500","#0d8200","#007d06","#007d06","#00731a","#00731a","#00731a","#00731a","#00731a","#00731a","#00731a","#00731a","#00731a","#00731a","#00731a","#00731a","#00731a","#007d06","#007d06","#007d06","#0d8200","#0d8200","#0d8200","#007d06","#00731a","#00731a","#006a2d","#006040","#006040","#005653","#005653","#004d66"],"pointHoverBackgroundColor":"#44739e","pointHoverBorderColor":"#44739e","spanGaps":true,"lineTension":0.4,"borderWidth":2,"fill":false,"backgroundColor":"#44739e33"}],"options":{"responsive":true,"maintainAspectRatio":false,"layout":{"padding":{"top":"20","left":0,"right":0,"bottom":0}},"hover":{"mode":"nearest"},"chartArea":{"backgroundColor":""},"scales":{"xAxes":[{"position":"bottom","scaleLabel":{"display":false,"labelString":""},"ticks":{"display":true,"autoSkip":false,"autoSkipPadding":10,"minRotation":0,"maxRotation":0,"fontColor":"#c3bbbb","padding":0},"gridLines":{"display":true,"color":"#c3bbbb","lineWidth":0.1,"drawBorder":true,"drawOnChartArea":"true","drawTicks":"true","tickMarkLength":5,"zeroLineWidth":1,"zeroLineColor":"rgba(0, 0, 0, 0.25)","offsetGridLines":false},"id":"0","display":true,"stacked":false,"type":"time","bounds":"ticks","time":{"displayFormats":{"millisecond":"H:mm:ss.SSS","second":"H:mm:ss","minute":"H:mm","hour":"dd.[\\n]H:mm","day":"dd[\\n]DD.MM","week":"dd[\\n]DD.MM","month":"MMM[\\n]YYYY","quarter":"[Q]Q - YYYY","year":"YYYY"},"tooltipFormat":"lll"}}],"yAxes":[{"id":"yAxis_id_0","type":"linear","position":"left","display":false,"stacked":false,"scaleLabel":{"display":false,"labelString":""},"ticks":{"autoSkip":true,"padding":10},"gridLines":{"display":true,"color":"black","lineWidth":0.1,"drawBorder":true,"drawOnChartArea":true,"drawTicks":true,"tickMarkLength":5,"zeroLineWidth":1,"zeroLineColor":"rgba(0, 0, 0, 0.25)"}}]},"legend":{"display":false,"position":"right","labels":{"boxWidth":10,"usePointStyle":"true","padding":10}},"tooltips":{"mode":"nearest","enabled":"true","backgroundColor":"black","caretSize":5,"caretPadding":2,"cornerRadius":4,"displayColors":true,"xPadding":10,"yPadding":10,"titleFontColor":"white","titleMarginBottom":6,"bodyFontColor":"white","callbacks":{}}}}
achja und falls das wichtig ist, noch das Skript das den JSON erstellt
// imports NPM Module

const moment = require('moment');
const chroma = require('chroma-js');

moment.locale('de');

let chart = {};
let values = [];
let axisLabels = [];
let colors = [];

for (var x = 0; x <=35; x++)
{
    var state_name = "weatherunderground.0.forecastHourly." + x + "h.";
    var temp = getState(state_name + 'temp').val;
    var time = getState(state_name + 'time').val;

    //console.log(Date.parse(time));

    values.push({"t": Date.parse(time), "y": temp});
    colors.push(getColor(temp));
}


chart = {
    graphs: [{
        data: values,
        type: 'line',
        legendText: "Temperatur",
        tooltip_text: "Temperatur",
		tooltip_MaxDigits: 1,
		tooltip_AppendText: " °C",
        datalabel_color: colors,
        line_PointColor: colors,
        line_PointColorBorder: colors,
        yAxis_show: "false",
        yAxis_appendix: " °C",
        xAxis_timeFormats: {
            millisecond: "H:mm:ss.SSS",
            second: "H:mm:ss",
            minute: "H:mm",
            hour: "dd.[\\n]H:mm",
            day: "dd[\\n]DD.MM",
            week: "dd[\\n]DD.MM",
            month: "MMM[\\n]YYYY",
            quarter: "[Q]Q - YYYY",
            year: "YYYY"
        }


    }]

}

setState('javascript.0.vorhersage.json', JSON.stringify(chart), true);

function getColor(temp) {

    let scale = chroma.scale(['blue', 'green', 'orange', 'red']);

    let tempMax = 30;
    let tempMin = -10;


    if (temp > tempMax) {

        return scale(1).hex();

    } else if (temp < tempMin) {

        return scale(0).hex();

    } else {

        return scale(temp / (tempMax - tempMin)).hex();

    }

}
Danke an alle, bei denen ich geklaut habe
-
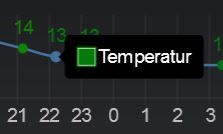
Also, das mit dem leeren Tooltip konnte ich lösen:
tooltip_text: "Temperatur",in
tooltip_title: "Temperatur",geändert.
Als ich zum Testen noch
        xAxis_tooltip_timeFormats: {
            millisecond: "H:mm:ss.SSS",
            second: "H:mm:ss",
            minute: "H:mm",
            hour: "dd.[\\n]H:mm",
            day: "dd[\\n]DD.MM",
            week: "dd[\\n]DD.MM",
            month: "MMM[\\n]YYYY",
            quarter: "[Q]Q - YYYY",
            year: "YYYY"
        },
eingefügt habe, tauchten in der Firefox Konsole folgende Fehler auf:
TypeError: e.replace is not a function       moment-with-locales.min.js:28:5029

    F                 moment-with-locales.min.js:28
    A                 moment-with-locales.min.js:28
    format            moment-with-locales.min.js:28
    format            lib.min.js:6
    getLabelForIndex  lib.min.js:6
    At                lib.min.js:1
    update            lib.min.js:4
    handleEvent       lib.min.js:4
    eventHandler      lib.min.js:4
    n                 lib.min.js:4
    <anonym>          lib.min.js:4
    sentryWrapped     helpers.ts:85


TypeError: e.title is undefined2                              lib.min.js:4:18453
    draw               https://192.168.116.246:8582/vis/widgets/materialdesign/lib.min.js:4
    _drawTooltip       https://192.168.116.246:8582/vis/widgets/materialdesign/lib.min.js:4
    draw               https://192.168.116.246:8582/vis/widgets/materialdesign/lib.min.js:4
    render             https://192.168.116.246:8582/vis/widgets/materialdesign/lib.min.js:4
    callback           https://192.168.116.246:8582/vis/widgets/materialdesign/lib.min.js:2
    advance            https://192.168.116.246:8582/vis/widgets/materialdesign/lib.min.js:3
    startDigest        https://192.168.116.246:8582/vis/widgets/materialdesign/lib.min.js:3
    request            https://192.168.116.246:8582/vis/widgets/materialdesign/lib.min.js:3
und es wird kein Tooltip mehr angezeigt.
Ob das damit zusammenhängt? keine Ahnung
-
Die Firefoxfehler hab ich jetzt auch weg:
Wer lesen kann ist klar im Vorteil....
xAxis_tooltip_timeFormats "type" ist halt "string" und nicht "object"...Aber das Hauptproblen, dass die Wochentage nicht mehr angezeigt werden, besteht leider immer noch...
-
So, wieder einen Schritt weiter...
Nach dem ich den Eintrag bei xAxis_tooltip_timeFormats -> minute: in "dd.[\n]H:mm" geändert habe, ist meine Beschriftung wieder im richtigen Format.
Warum er aber nun das "Minute"-Format nutzt, erschließt sich mir nicht, da die Abstände der Timestamps immer noch stündlich sind.
Was aber leider immer noch nicht funktionert ist, daß er jetzt die Beschriftung nicht mehr im 2-stündlichen Abstand schreibt, sondern jede Stunde.
Der Haken bei "Automatische Überspringen von Beschriftungen auf der X-Achse" macht keinen Unterschied.Was mir auch noch aufgefallen ist, dass die Beschriftung nicht mehr "synchron" zu den Daten ist, wenn man im Widget nicht explizit die "maximale Anzahl der Beschriftungen" festlegt!
Ohne Eintrag:
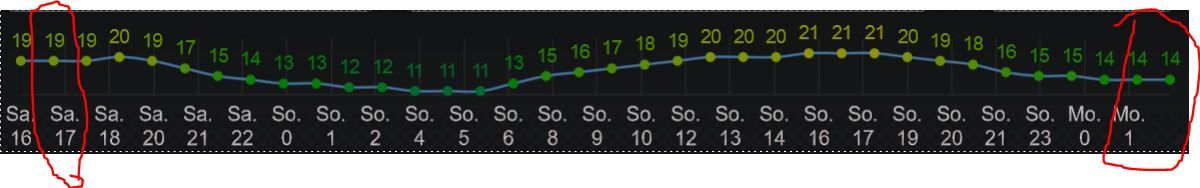
Mit maximale Anzahl der Achsenbeschriftung -> 35:
P.S. ist der Thread hier eigentlich tot, oder interessiert das nur niemand

-
@Boronsbruder
Ne nicht tot, hab immer die Hoffnung das auch jemand anderes antwortetPoste mal den json string für den Chart, dann schau ich es mir an.
-
{"graphs":[{"data":[{"t":1592676000000,"y":18},{"t":1592679600000,"y":16},{"t":1592683200000,"y":15},{"t":1592686800000,"y":14},{"t":1592690400000,"y":14},{"t":1592694000000,"y":13},{"t":1592697600000,"y":12},{"t":1592701200000,"y":12},{"t":1592704800000,"y":12},{"t":1592708400000,"y":11},{"t":1592712000000,"y":11},{"t":1592715600000,"y":13},{"t":1592719200000,"y":15},{"t":1592722800000,"y":17},{"t":1592726400000,"y":18},{"t":1592730000000,"y":19},{"t":1592733600000,"y":19},{"t":1592737200000,"y":20},{"t":1592740800000,"y":21},{"t":1592744400000,"y":21},{"t":1592748000000,"y":21},{"t":1592751600000,"y":21},{"t":1592755200000,"y":21},{"t":1592758800000,"y":21},{"t":1592762400000,"y":20},{"t":1592766000000,"y":18},{"t":1592769600000,"y":17},{"t":1592773200000,"y":16},{"t":1592776800000,"y":15},{"t":1592780400000,"y":15},{"t":1592784000000,"y":14},{"t":1592787600000,"y":14},{"t":1592791200000,"y":14},{"t":1592794800000,"y":14},{"t":1592798400000,"y":14},{"t":1592802000000,"y":15}],"type":"line","legendText":"","tooltip_title":"Temperatur","tooltip_MaxDigits":2,"tooltip_AppendText":" °C","datalabel_color":["#598d00","#338700","#208500","#0d8200","#0d8200","#007d06","#00731a","#00731a","#00731a","#006a2d","#006a2d","#007d06","#208500","#468a00","#598d00","#6c9000","#6c9000","#809300","#939500","#939500","#939500","#939500","#939500","#939500","#809300","#598d00","#468a00","#338700","#208500","#208500","#0d8200","#0d8200","#0d8200","#0d8200","#0d8200","#208500"],"line_PointColor":["#598d00","#338700","#208500","#0d8200","#0d8200","#007d06","#00731a","#00731a","#00731a","#006a2d","#006a2d","#007d06","#208500","#468a00","#598d00","#6c9000","#6c9000","#809300","#939500","#939500","#939500","#939500","#939500","#939500","#809300","#598d00","#468a00","#338700","#208500","#208500","#0d8200","#0d8200","#0d8200","#0d8200","#0d8200","#208500"],"line_PointColorBorder":["#598d00","#338700","#208500","#0d8200","#0d8200","#007d06","#00731a","#00731a","#00731a","#006a2d","#006a2d","#007d06","#208500","#468a00","#598d00","#6c9000","#6c9000","#809300","#939500","#939500","#939500","#939500","#939500","#939500","#809300","#598d00","#468a00","#338700","#208500","#208500","#0d8200","#0d8200","#0d8200","#0d8200","#0d8200","#208500"],"yAxis_show":"false","yAxis_appendix":" °C","xAxis_timeFormats":{"millisecond":"H:mm:ss.SSS","second":"H:mm:ss","minute":"dd.[\\n]H","hour":"dd.[\\n]H:mm","day":"dd[\\n]DD.MM","week":"dd[\\n]DD.MM","month":"MMM[\\n]YYYY","quarter":"[Q]Q - YYYY","year":"YYYY"}}]}Das ist er.
Dank dir schon mal im Vorraus -
@Boronsbruder sagte in Material Design Widgets: JSON Chart Widget:
Warum er aber nun das "Minute"-Format nutzt, erschließt sich mir nicht, da die Abstände der Timestamps immer noch stündlich sind.
Weil die API immer versucht die Achse optimal zu erstellen. Wenn du jetzt wieder Minuten im timeformat aktivierst, siehst du das die Achsenschritte in Minuten sind.
Was aber leider immer noch nicht funktionert ist, daß er jetzt die Beschriftung nicht mehr im 2-stündlichen Abstand schreibt, sondern jede Stunde.
Bei 35 Werten (= Stunden) alle zwei Stunden anzeigen, muss du bei
maximale Anzahl der Beschriftungdie Hälfte eintragen, also 17 / 18 Kommawerte gehen nicht.Der Haken bei "Automatische Überspringen von Beschriftungen auf der X-Achse" macht keinen Unterschied.
Was mir auch noch aufgefallen ist, dass die Beschriftung nicht mehr "synchron" zu den Daten ist, wenn man im Widget nicht explizit die "maximale Anzahl der Beschriftungen" festlegt!
Ohne Eintrag:
Mit maximale Anzahl der Achsenbeschriftung -> 35:
Gleiche Ursache wie oben, er nimmt hier Minute aber du blendest sie aus.
Hier mal zwei screenshots dazu: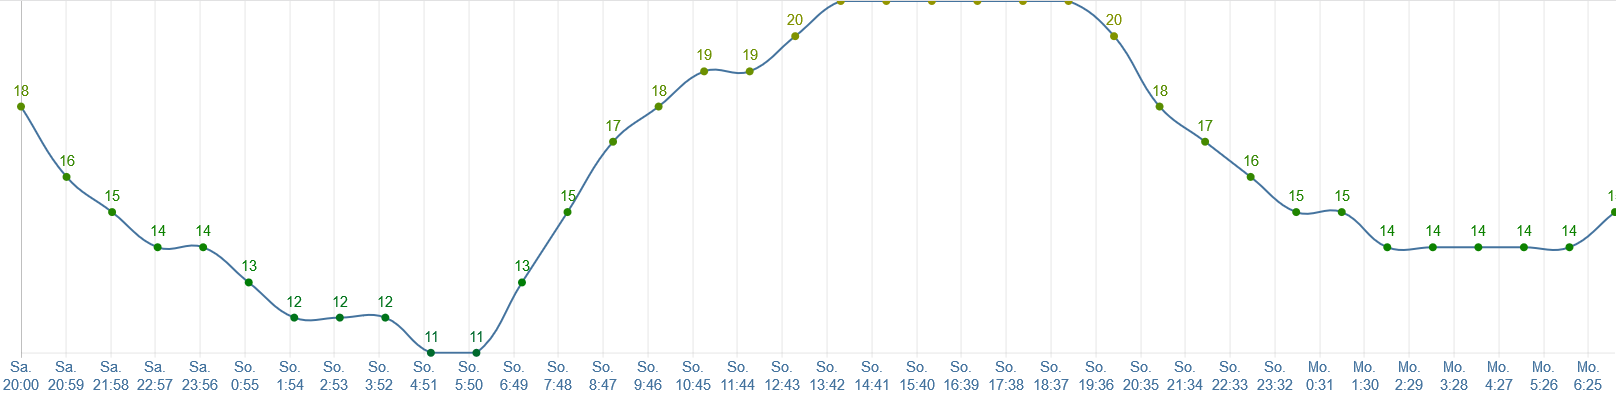
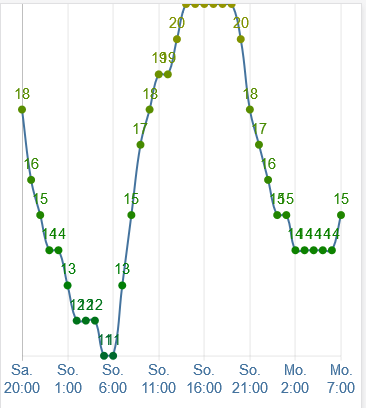
Wie du erkennst passt er je nach Größe automatisch die Achse an.
So jetzt noch die gute Nachricht. Hab noch eine Möglichkeit in der API entdeckt, wodurch das besser geht. Ist in der kommenden Verison enthalten.
-
@Scrounger
Danke für die Infos!Kann ich der Api vorgeben, ob ich stündlich oder minütlich haben will?
Vorher war die Darstellung ja so:Vor den Updates


