Navigation

    Logo
    • Register
    • Login
    • Search
    • Recent
    • Tags
    • Unread
    • Categories
    • Unreplied
    • Popular
    • GitHub
    • Docu
    • Hilfe
    1. Home
    2. Deutsch
    3. Visualisierung
    4. Material Design Widgets: JSON Chart Widget

    NEWS

    • ioBroker@Smart Living Forum Solingen, 14.06. - Agenda added

    • ioBroker goes Matter ... Matter Adapter in Stable

    • Monatsrückblick - April 2025

    Material Design Widgets: JSON Chart Widget

    This topic has been deleted. Only users with topic management privileges can see it.
    • O
      Oli @Scrounger last edited by

      @Scrounger

      ich habe leider das gleiche Problem wie @Stephan-Schleich

      Ich wollte mir den UV Index vom OpenUV Adapter auslesen und habe versucht das Script von dir anzupassen.
      Anpassungen erfolgten in folgenden Zeilen:
      7
      22
      28
      19
      24-31
      39

      Die Daten sollen aus folgenden Datenpunkt vom History Adapter geholt werden:
      "openuv.0.UV"

      // imports NPM Module
      const moment = require("moment");
      moment.locale("de");
      
      // Skript Einstellungen *************************************************************************************************************************************************
      let debug = true;                                                                                           // Debug Meldungen anzeigen
      let strukturChannel = '0_userdata.0.Wetter.Diagramme.UvIndex';                                               // Übergeordnete Id, wo die Datenpunkte angelegt werden sollen
      
      let idTimeIntervalDatenpunkt = `${strukturChannel}.Control.timeInterval`                                    // Datenpunkt um Zeitinterval bei Graph zu ändern
      
      let historyInstance = 'history.0';                                                                          // History Instanz die verwendet werden soll
      let historyDefaultAggregate = 'max';                                                                        // History Daten Aggregation, siehe https://github.com/ioBroker/ioBroker.javascript/blob/master/docs/en/javascript.md#gethistory
      let historyDefaultCount = 20;                                                                               // Anzahl der History Daten die dargestellt werden
      let historyDefaultTimeout = 2000;                                                                           // History Instance Timeout in ms, nur erhöhen wenn graph Fehlemeldung zu timeout anzeigt
      
      let channels = [                                                                                            // Channels des Systems die verwendet werden sollen
         {
             idTarget: 'UvIndex',                                                                               // Name Eures Ziel Datenpunktes, wird aus 'strukturChannel' + 'idDatenpunkt' zusammengesetzt
             idChannel: 'openuv.0'                                                                              // id des Channels des Coronavirus-Statistics die verwendet werden sollen
         }
      ]
      
      let datenpunkte = [
         /*{
             id: 'CPU.Auslastung',                                                                                                                           // Ids die verwendet werden sollen und deren Einstellungen
             graphSettings: { type: 'bar', color: '#FF8C00', legendText: 'CPU', yAxis_id: 0, displayOrder: 1 }                                               // Einstellung für graph
         },*/
         {
             id: 'UV',                                                                                                                           // Ids die verwendet werden sollen und deren Einstellungen
             graphSettings: { type: 'linie', color: '#FF8C00', legendText: 'UV-Index', yAxis_id: 0, line_UseFillColor: true, displayOrder: 0 }                                               // Einstellung für graph
         },    
      ]
      
      let globalGraphSettings = {                                                                                 // gemeinsam verwendet Chart Einstellungen, details siehe https://github.com/Scrounger/ioBroker.vis-materialdesign#json-chart    
         line_Thickness: 2,
         line_pointSize: 0,
         datalabel_show: false,
         yAxis_min: 0,
         yAxis_max: 15,
         yAxis_zeroLineWidth: 0,
         xAxis_bounds: 'ticks',
         xAxis_timeFormats: {
             millisecond: "H:mm:ss.SSS",
             second: "H:mm:ss",
             minute: "H:mm",
             hour: "dd.[\\n]H:mm",
             day: "dd[\\n]DD.MM",
             week: "dd[\\n]DD.MM",
             month: "MMM[\\n]YYYY",
             quarter: "[Q]Q - YYYY",
             year: "YYYY"
         }
      }
      
      // **********************************************************************************************************************************************************************
      
      function refreshData() {
         try {
             createControlDatapoints();
      
             let start = getChartStart();
             let end = moment();
             if (debug) console.debug(`[refreshData]: chart time interval: start: ${start.format('LLL')}, end: ${end.format('LLL')}`)
      
             let historyOptions = {
                 start: start.valueOf(),
                 end: end.valueOf()
             }
      
             for (const channel of channels) {
                 let graphs = [];
      
                 for (const datenpunkt of datenpunkte) {
                     let idSource = `${channel.idChannel}.${datenpunkt.id}`;
      
                     if (existsState(idSource)) {
                         // create Json Data for Graph
                         if (debug) console.debug(`[refreshData]: get history data for datapoint '${idSource}'`);
      
                         historyOptions.aggregate = (datenpunkt.graphSettings.aggregate) ? datenpunkt.graphSettings.aggregate : historyDefaultAggregate;
                         historyOptions.count = (datenpunkt.graphSettings.count) ? datenpunkt.graphSettings.count : historyDefaultCount;
                         historyOptions.timeout = (datenpunkt.graphSettings.timeout) ? datenpunkt.graphSettings.timeout : historyDefaultTimeout;
      
                         if (debug) console.debug(`[refreshData]: chart options for '${datenpunkt.id}': ${JSON.stringify(historyOptions)}`);
      
                         let historyData = getHistoryGraphData(idSource, historyInstance, historyOptions, datenpunkt.graphSettings);
      
                         if (historyData) {
                             graphs.push(historyData);
                         }
      
                     } else {
                         if (debug) console.warn(`[refreshData]: datapoint '${idSource}' not exist! Perhaps you must activate it in the settings of Coronavirus-Statistics Adapter or delete it from the skript`);
                     }
      
                     Promise.all(graphs).then((result) => {
                         mySetState(`${strukturChannel}.${channel.idTarget}`, JSON.stringify({ graphs: result }), 'string', `${channel.idTarget} Daten für JsonChart Widget`);
                     });
                 }
             }
      
         } catch (err) {
             console.error(`[refreshData] error: ${err.message}, stack: ${err.stack}`);
         }
      }
      
      refreshData();
      
      function createControlDatapoints() {
         if (!existsState(idTimeIntervalDatenpunkt)) {
             if (debug) console.debug(`[createControlDatapoints]: create datapoint '${idTimeIntervalDatenpunkt}'`);
             mySetState(idTimeIntervalDatenpunkt, '7 days', 'string', `Filter für Charts`);
         }
      }
      
      function getChartStart() {
         let startDateTime = moment();
      
         if (existsState(idTimeIntervalDatenpunkt)) {
             let val = getState(idTimeIntervalDatenpunkt).val;
      
             if (val === '1 hour') {
                 startDateTime.add('-1', 'hours');
                 // startDateTime = startDateTime.startOf('hour');
             } else if (val === '1 day') {
                 startDateTime.add('-1', 'days');
             } else if (val === '3 days') {
                 startDateTime.add('-3', 'days');
                 startDateTime = startDateTime.startOf('day');
             } else if (val === '7 days') {
                 startDateTime.add('-7', 'days');
                 startDateTime = startDateTime.startOf('day');
             } else if (val === '14 days') {
                 startDateTime.add('-14', 'days');
                 startDateTime = startDateTime.startOf('day');
             } else if (val === '1 month') {
                 startDateTime.add('-1', 'months');
                 startDateTime = startDateTime.startOf('day');
             } else if (val === '2 months') {
                 startDateTime.add('-2', 'months');
                 startDateTime = startDateTime.startOf('day');
             } else if (val === '3 months') {
                 startDateTime.add('-3', 'months');
                 startDateTime = startDateTime.startOf('day');
             } else if (val === '6 months') {
                 startDateTime.add('-6', 'months');
                 startDateTime = startDateTime.startOf('day');
             } else if (val === '1 year') {
                 startDateTime.add('-1', 'years');
                 startDateTime = startDateTime.startOf('day');
             } else {
                 startDateTime.add('-7', 'days');
                 startDateTime = startDateTime.startOf('day');
             }
         } else {
             startDateTime.add('-7', 'days');
             startDateTime = startDateTime.startOf('day');
         }
      
         return startDateTime;
      }
      
      function getHistoryGraphData(id, historyInstance, options, graphSettings) {
         try {
             // graphSettings must be cloned to new var, prevent pointing to same memory adress because promise is in for loop
             let graph = Object.assign({ ...graphSettings }, globalGraphSettings);
      
             let obj = getObject(id);
             if (obj && obj.common && obj.common.custom && obj.common.custom[historyInstance]) {
                 return new Promise((resolve, reject) => {
                     sendTo(historyInstance, 'getHistory', {
                         id: id,
                         options: options
                     }, function (query) {
                         graph.data = getPreparedData(query.result)
                         resolve(graph);
                     });
      
                 });
             } else {
                 if (debug) console.warn(`[getHistoryGraphData]: no history instance '${historyInstance}' exist for datapoint '${id}'!`);
             }
      
             return undefined
      
             function getPreparedData(data) {
                 if (data) {
                     return data.map(elm => ({
                         t: (elm.ts !== null && elm.ts !== undefined) ? elm.ts : null,
                         y: (elm.val !== null && elm.val !== undefined) ? elm.val : null
                     }));
                 }
                 return [];
             };
         } catch (ex) {
             console.error(`[getHistoryGraphData]: error: ${ex.message}, stack: ${ex.stack}`);
         }
      };
      
      function mySetState(id, val, type, name) {
         if (existsState(id)) {
             if (debug) console.debug(`[mySetState]: history chart data stored to '${id}'`);
             setState(id, val, true);
         } else {
             if (debug) console.debug(`[mySetState]: create datapoint '${id}'`);
             createUserStates(false, [
                 id, {
                     'name': name,
                     'type': type,
                     'read': true,
                     'write': true
                 }
             ], function () {
                 setState(id, val, true);
             });
         }
      }
      
      /**
      * Create states under 0_userdata.0 or javascript.x
      * Current Version:     https://github.com/Mic-M/iobroker.createUserStates
      * Support:             https://forum.iobroker.net/topic/26839/
      * Autor:               Mic (ioBroker) | Mic-M (github)
      * Version:             1.1 (26 January 2020)
      * Example:             see https://github.com/Mic-M/iobroker.createUserStates#beispiel
      * -----------------------------------------------
      * PLEASE NOTE: Per https://github.com/ioBroker/ioBroker.javascript/issues/474, the used function setObject() 
      *              executes the callback PRIOR to completing the state creation. Therefore, we use a setTimeout and counter. 
      * -----------------------------------------------
      * @param {boolean} force         Force state creation (overwrite), if state is existing.
      * @param {array} statesToCreate  State(s) to create. single array or array of arrays
      * @param {object} [callback]     Optional: a callback function -- This provided function will be executed after all states are created.
      */
      function createUserStates(force, statesToCreate, callback = undefined) {
         const where = '0_userdata.0'
      
         const WARN = false; // Only for 0_userdata.0: Throws warning in log, if state is already existing and force=false. Default is false, so no warning in log, if state exists.
         const LOG_DEBUG = false; // To debug this function, set to true
         // Per issue #474 (https://github.com/ioBroker/ioBroker.javascript/issues/474), the used function setObject() executes the callback 
         // before the state is actual created. Therefore, we use a setTimeout and counter as a workaround.
         const DELAY = 50; // Delay in milliseconds (ms). Increase this to 100, if it is not working.
      
         // Validate "where"
         if (where.endsWith('.')) where = where.slice(0, -1); // Remove trailing dot
         if ((where.match(/^((javascript\.([1-9][0-9]|[0-9]))$|0_userdata\.0$)/) == null)) {
             log('This script does not support to create states under [' + where + ']', 'error');
             return;
         }
      
         // Prepare "statesToCreate" since we also allow a single state to create
         if (!Array.isArray(statesToCreate[0])) statesToCreate = [statesToCreate]; // wrap into array, if just one array and not inside an array
      
         // Add "where" to STATES_TO_CREATE
         for (let i = 0; i < statesToCreate.length; i++) {
             let lpPath = statesToCreate[i][0].replace(/\.*\./g, '.'); // replace all multiple dots like '..', '...' with a single '.'
             lpPath = lpPath.replace(/^((javascript\.([1-9][0-9]|[0-9])\.)|0_userdata\.0\.)/, '') // remove any javascript.x. / 0_userdata.0. from beginning
             lpPath = where + '.' + lpPath; // add where to beginning of string
             statesToCreate[i][0] = lpPath;
         }
      
         if (where != '0_userdata.0') {
             // Create States under javascript.x
             let numStates = statesToCreate.length;
             statesToCreate.forEach(function (loopParam) {
                 if (LOG_DEBUG) log('[Debug] Now we are creating new state [' + loopParam[0] + ']');
                 let loopInit = (loopParam[1]['def'] == undefined) ? null : loopParam[1]['def']; // mimic same behavior as createState if no init value is provided
                 createState(loopParam[0], loopInit, force, loopParam[1], function () {
                     numStates--;
                     if (numStates === 0) {
                         if (LOG_DEBUG) log('[Debug] All states processed.');
                         if (typeof callback === 'function') { // execute if a function was provided to parameter callback
                             if (LOG_DEBUG) log('[Debug] Function to callback parameter was provided');
                             return callback();
                         } else {
                             return;
                         }
                     }
                 });
             });
         } else {
             // Create States under 0_userdata.0
             let numStates = statesToCreate.length;
             let counter = -1;
             statesToCreate.forEach(function (loopParam) {
                 counter += 1;
                 if (LOG_DEBUG) log('[Debug] Currently processing following state: [' + loopParam[0] + ']');
                 if (($(loopParam[0]).length > 0) && (existsState(loopParam[0]))) { // Workaround due to https://github.com/ioBroker/ioBroker.javascript/issues/478
                     // State is existing.
                     if (WARN && !force) log('State [' + loopParam[0] + '] is already existing and will no longer be created.', 'warn');
                     if (!WARN && LOG_DEBUG) log('[Debug] State [' + loopParam[0] + '] is already existing. Option force (=overwrite) is set to [' + force + '].');
                     if (!force) {
                         // State exists and shall not be overwritten since force=false
                         // So, we do not proceed.
                         numStates--;
                         if (numStates === 0) {
                             if (LOG_DEBUG) log('[Debug] All states successfully processed!');
                             if (typeof callback === 'function') { // execute if a function was provided to parameter callback
                                 if (LOG_DEBUG) log('[Debug] An optional callback function was provided, which we are going to execute now.');
                                 return callback();
                             }
                         } else {
                             // We need to go out and continue with next element in loop.
                             return; // https://stackoverflow.com/questions/18452920/continue-in-cursor-foreach
                         }
                     } // if(!force)
                 }
      
                 // State is not existing or force = true, so we are continuing to create the state through setObject().
                 let obj = {};
                 obj.type = 'state';
                 obj.native = {};
                 obj.common = loopParam[1];
                 setObject(loopParam[0], obj, function (err) {
                     if (err) {
                         log('Cannot write object for state [' + loopParam[0] + ']: ' + err);
                     } else {
                         if (LOG_DEBUG) log('[Debug] Now we are creating new state [' + loopParam[0] + ']')
                         let init = null;
                         if (loopParam[1].def === undefined) {
                             if (loopParam[1].type === 'number') init = 0;
                             if (loopParam[1].type === 'boolean') init = false;
                             if (loopParam[1].type === 'string') init = '';
                         } else {
                             init = loopParam[1].def;
                         }
                         setTimeout(function () {
                             setState(loopParam[0], init, true, function () {
                                 if (LOG_DEBUG) log('[Debug] setState durchgeführt: ' + loopParam[0]);
                                 numStates--;
                                 if (numStates === 0) {
                                     if (LOG_DEBUG) log('[Debug] All states processed.');
                                     if (typeof callback === 'function') { // execute if a function was provided to parameter callback
                                         if (LOG_DEBUG) log('[Debug] Function to callback parameter was provided');
                                         return callback();
                                     }
                                 }
                             });
                         }, DELAY + (20 * counter));
                     }
                 });
             });
         }
      }


      Folgendes Json wird geschrieben:

      {"graphs":[{"type":"linie","color":"#FF8C00","legendText":"UV-Index","yAxis_id":0,"line_UseFillColor":true,"displayOrder":0,"line_Thickness":2,"line_pointSize":0,"datalabel_show":false,"yAxis_min":0,"yAxis_max":15,"yAxis_zeroLineWidth":0,"xAxis_bounds":"ticks","xAxis_timeFormats":{"millisecond":"H:mm:ss.SSS","second":"H:mm:ss","minute":"H:mm","hour":"dd.[\\n]H:mm","day":"dd[\\n]DD.MM","week":"dd[\\n]DD.MM","month":"MMM[\\n]YYYY","quarter":"[Q]Q - YYYY","year":"YYYY"},"data":[{"t":1586556000000,"y":null},{"t":1586572168731,"y":0.7257},{"t":1586604506194,"y":0},{"t":1586636843656,"y":0},{"t":1586669181118,"y":4.5307},{"t":1586701518581,"y":5.5938},{"t":1586733856043,"y":0},{"t":1586766193505,"y":5.5113},{"t":1586798530968,"y":4.6673},{"t":1586830868430,"y":0.6749},{"t":1586863205892,"y":5.7168},{"t":1586895543355,"y":0.8337},{"t":1586927880817,"y":4.325},{"t":1586960218279,"y":5.555},{"t":1586992555742,"y":0},{"t":1587024893204,"y":5.8891},{"t":1587057230666,"y":4.8084},{"t":1587089568129,"y":0.6144},{"t":1587121905591,"y":5.341},{"t":1587154243053,"y":0.8423},{"t":1587186580516,"y":4.1001}]}]}
      

      Die bisherige Darstellung erfolgte über Flot Diagramme

      Wo mache ich hier bitte den Fehler?

      Datenpunkte lassen auch nur unter userdata anlegen.

      Mic-M created this issue in ioBroker/ioBroker.javascript

      closed setObject() function: callback not working as intended. #474

      Mic-M created this issue in ioBroker/ioBroker.javascript

      closed setObject() function: callback not working as intended. #474

      Mic-M created this issue in ioBroker/ioBroker.javascript

      closed 0_userdata.0: existsState() vs. $-Selector $().length after state deletion #478

      1 Reply Last reply Reply Quote 0
      • Scrounger
        Scrounger Developer @Atredis last edited by Scrounger

        @Atredis sagte in Material Design Widgets: JSON Chart Widget:

        Welches Format muss das JSON haben um Angezeigt zu werden.

        steht in der Doku:
        https://github.com/Scrounger/ioBroker.vis-materialdesign#json-chart

        Schau dir die Beispiele an:
        https://forum.iobroker.net/topic/26925/test-adapter-material-design-widgets-v0-2-x/857

        @Stephan-Schleich sagte in Material Design Widgets: JSON Chart Widget:

        Ich hab nur einen Ladekreis wenn ich einen JSON DP hinterlege

        @Oli sagte in Material Design Widgets: JSON Chart Widget:

        ich habe leider das gleiche Problem wie @Stephan-Schleich

        Benötige den json string und die skripte, damit ich weiterhelfen kann.

        O 1 Reply Last reply Reply Quote 0
        • O
          Oli @Scrounger last edited by

          @Scrounger

          danke schon mal im Voraus, das Script ist bereits im Spoiler vorhanden.

          Was meinst du mit json string?

          Scrounger 1 Reply Last reply Reply Quote 0
          • Scrounger
            Scrounger Developer @Oli last edited by

            @Oli
            Habs nur halb gelesen 😉
            Alle Infos da, schaus mir an.

            O 1 Reply Last reply Reply Quote 0
            • O
              Oli @Scrounger last edited by

              @Scrounger

              danke

              Scrounger 1 Reply Last reply Reply Quote 0
              • Scrounger
                Scrounger Developer @Oli last edited by Scrounger

                @Oli
                axislabel fehlt

                Edit:
                Oh sollte echt mal richtig lesen. 😉 Du verwendest timestamps für die x-achse.

                Hast nen tipp fehler:

                "type": "linie",
                

                muss

                "type": "line",
                

                Das steht auch in der console log, wenn man den debug modus aktiviert hat.

                O 2 Replies Last reply Reply Quote 1
                • O
                  Oli @Scrounger last edited by

                  @Scrounger

                  super, danke funktioniert

                  1 Reply Last reply Reply Quote 0
                  • O
                    Oli @Scrounger last edited by

                    @Scrounger

                    hast du auch mal nach dem 2 Thema aus meinem Poste geschaut?

                    Wenn ich im Script Zeile 7

                    let strukturChannel = '0_userdata.0.Wetter.Diagramme.UvIndex';
                    

                    "0_userdata.0.Wetter.Diagramme.UvIndex" gegen "javascript.0.Wetter.Diagramme.UvIndex" tausche bringt er mir folgende Warnungen und die Datenpunkte werden nicht angelegt

                    javascript.0	2020-04-18 13:25:55.275	warn	(5564) at process._tickCallback (internal/process/next_tick.js:68:7)
                    javascript.0	2020-04-18 13:25:55.275	warn	(5564) at Promise.all.then (script.js.Diagramme.Diagramm_Test:97:21)
                    javascript.0	2020-04-18 13:25:55.275	warn	(5564) at mySetState (script.js.Diagramme.Diagramm_Test:206:9)
                    javascript.0	2020-04-18 13:25:55.275	warn	(5564) at createUserStates (script.js.Diagramme.Diagramm_Test:284:24)
                    javascript.0	2020-04-18 13:25:55.274	warn	(5564) at Array.forEach (<anonymous>:null:null)
                    javascript.0	2020-04-18 13:25:55.274	warn	(5564) at script.js.Diagramme.Diagramm_Test:299:36
                    javascript.0	2020-04-18 13:25:55.274	warn	(5564) at script.js.Diagramme.Diagramm_Test:214:13
                    javascript.0	2020-04-18 13:25:55.274	warn	(5564) at setState (/opt/iobroker/node_modules/iobroker.javascript/lib/sandbox.js:1404:20)
                    javascript.0	2020-04-18 13:25:55.273	warn	(5564) State "javascript.0.Wetter.Diagramme.UvIndex.UvIndex" not found
                    
                    Scrounger 1 Reply Last reply Reply Quote 0
                    • Scrounger
                      Scrounger Developer @Oli last edited by Scrounger

                      @Oli
                      Edit:
                      Ok Frage betrifft Wigdet aber auch nciht, sondern ist eine Frage bzgl. skripts:

                      Es wird in dem Beispiel nur '0_userdata.0' unterstützt, weil es in zeile 235 hard coded ist:

                         const where = '0_userdata.0'
                      
                      1 Reply Last reply Reply Quote 0
                      • Boronsbruder
                        Boronsbruder last edited by Boronsbruder

                        Ich hab mal ne Frage...
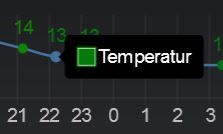
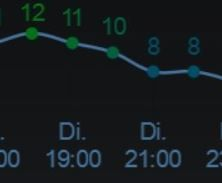
                        Nach nem Update von Node und NPM und einiger npm module (ich glaube "moment" war auch mit dabei) hat sich mein "Wettertrend" von ehemals
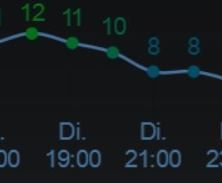
                        wettertrend_alt.JPG

                        nach

                        ausgeschnitten_wetter.JPG

                        geändert.

                        Der Tooltip ist jetzt auch leer...

                        Das Javascript, das den JSON erstellt wurde nicht geändert.

                        und nun die Frage: "Warum ist das so?" 🤦

                        Das ist der JSON

                        {"graphs":[{"data":[{"t":1591455600000,"y":17},{"t":1591459200000,"y":17},{"t":1591462800000,"y":16},{"t":1591466400000,"y":16},{"t":1591470000000,"y":15},{"t":1591473600000,"y":14},{"t":1591477200000,"y":13},{"t":1591480800000,"y":13},{"t":1591484400000,"y":12},{"t":1591488000000,"y":12},{"t":1591491600000,"y":12},{"t":1591495200000,"y":12},{"t":1591498800000,"y":12},{"t":1591502400000,"y":12},{"t":1591506000000,"y":12},{"t":1591509600000,"y":12},{"t":1591513200000,"y":12},{"t":1591516800000,"y":12},{"t":1591520400000,"y":12},{"t":1591524000000,"y":12},{"t":1591527600000,"y":12},{"t":1591531200000,"y":13},{"t":1591534800000,"y":13},{"t":1591538400000,"y":13},{"t":1591542000000,"y":14},{"t":1591545600000,"y":14},{"t":1591549200000,"y":14},{"t":1591552800000,"y":13},{"t":1591556400000,"y":12},{"t":1591560000000,"y":12},{"t":1591563600000,"y":11},{"t":1591567200000,"y":10},{"t":1591570800000,"y":10},{"t":1591574400000,"y":9},{"t":1591578000000,"y":9},{"t":1591581600000,"y":8}],"type":"line","legendText":"Temperatur","tooltip_text":"Temperatur","tooltip_MaxDigits":1,"tooltip_AppendText":" °C","datalabel_color":["#468a00","#468a00","#338700","#338700","#208500","#0d8200","#007d06","#007d06","#00731a","#00731a","#00731a","#00731a","#00731a","#00731a","#00731a","#00731a","#00731a","#00731a","#00731a","#00731a","#00731a","#007d06","#007d06","#007d06","#0d8200","#0d8200","#0d8200","#007d06","#00731a","#00731a","#006a2d","#006040","#006040","#005653","#005653","#004d66"],"line_PointColor":["#468a00","#468a00","#338700","#338700","#208500","#0d8200","#007d06","#007d06","#00731a","#00731a","#00731a","#00731a","#00731a","#00731a","#00731a","#00731a","#00731a","#00731a","#00731a","#00731a","#00731a","#007d06","#007d06","#007d06","#0d8200","#0d8200","#0d8200","#007d06","#00731a","#00731a","#006a2d","#006040","#006040","#005653","#005653","#004d66"],"line_PointColorBorder":["#468a00","#468a00","#338700","#338700","#208500","#0d8200","#007d06","#007d06","#00731a","#00731a","#00731a","#00731a","#00731a","#00731a","#00731a","#00731a","#00731a","#00731a","#00731a","#00731a","#00731a","#007d06","#007d06","#007d06","#0d8200","#0d8200","#0d8200","#007d06","#00731a","#00731a","#006a2d","#006040","#006040","#005653","#005653","#004d66"],"yAxis_show":"false","yAxis_appendix":" °C","xAxis_timeFormats":{"millisecond":"H:mm:ss.SSS","second":"H:mm:ss","minute":"H:mm","hour":"dd.[\\n]H:mm","day":"dd[\\n]DD.MM","week":"dd[\\n]DD.MM","month":"MMM[\\n]YYYY","quarter":"[Q]Q - YYYY","year":"YYYY"}}]}
                        

                        Und das Debug-LOG

                        JSON Chart w00114] widget setting: {"_data":{"wid":"w00114","oid":"javascript.0.vorhersage.json","g_fixed":true,"g_visibility":false,"g_css_font_text":true,"g_css_background":false,"g_css_shadow_padding":false,"g_css_border":false,"g_gestures":false,"g_signals":false,"g_last_change":false,"visibility-cond":"==","visibility-val":1,"visibility-groups-action":"hide","chartType":"line","showLegend":false,"legendPosition":"right","legendPointStyle":"true","showTooltip":"true","tooltipMode":"nearest","tooltipShowColorBox":true,"xAxisPosition":"bottom","xAxisValueDistanceToAxis":"","xAxisShowAxis":true,"xAxisShowAxisLabels":true,"xAxisShowGridLines":"true","xAxisShowTicks":"true","xAxisMinRotation":"0","xAxisMaxRotation":"0","yAxisValueDistanceToAxis":"10","signals-cond-0":"==","signals-val-0":true,"signals-icon-0":"/vis/signals/lowbattery.png","signals-icon-size-0":0,"signals-blink-0":false,"signals-horz-0":0,"signals-vert-0":0,"signals-hide-edit-0":false,"signals-cond-1":"==","signals-val-1":true,"signals-icon-1":"/vis/signals/lowbattery.png","signals-icon-size-1":0,"signals-blink-1":false,"signals-horz-1":0,"signals-vert-1":0,"signals-hide-edit-1":false,"signals-cond-2":"==","signals-val-2":true,"signals-icon-2":"/vis/signals/lowbattery.png","signals-icon-size-2":0,"signals-blink-2":false,"signals-horz-2":0,"signals-vert-2":0,"signals-hide-edit-2":false,"lc-type":"last-change","lc-is-interval":true,"lc-is-moment":false,"lc-format":"","lc-position-vert":"top","lc-position-horz":"right","lc-offset-vert":0,"lc-offset-horz":0,"lc-font-size":"12px","lc-font-family":"","lc-font-style":"","lc-bkg-color":"","lc-color":"","lc-border-width":"0","lc-border-style":"","lc-border-color":"","lc-border-radius":10,"lc-zindex":0,"mdwDebug":true,"chartPaddingTop":"20","name":"WetterTrend","legendFontColor":"","xAxisValueLabelColor":"#c3bbbb","xAxisGridLinesColor":"#c3bbbb","axisLabelAutoSkip":false,"xAxisValueFontSize":"","xAxisMaxLabel":"","xAxisTitle":"","xAxisOffsetGridLines":false,"tooltipBodyAppend":""},"_cid":".map102","_computedAttrs":{},"wid":"w00114","oid":"javascript.0.vorhersage.json","g_fixed":true,"g_visibility":false,"g_css_font_text":true,"g_css_background":false,"g_css_shadow_padding":false,"g_css_border":false,"g_gestures":false,"g_signals":false,"g_last_change":false,"visibility-cond":"==","visibility-val":1,"visibility-groups-action":"hide","chartType":"line","showLegend":false,"legendPosition":"right","legendPointStyle":"true","showTooltip":"true","tooltipMode":"nearest","tooltipShowColorBox":true,"xAxisPosition":"bottom","xAxisValueDistanceToAxis":"","xAxisShowAxis":true,"xAxisShowAxisLabels":true,"xAxisShowGridLines":"true","xAxisShowTicks":"true","xAxisMinRotation":"0","xAxisMaxRotation":"0","yAxisValueDistanceToAxis":"10","signals-cond-0":"==","signals-val-0":true,"signals-icon-0":"/vis/signals/lowbattery.png","signals-icon-size-0":0,"signals-blink-0":false,"signals-horz-0":0,"signals-vert-0":0,"signals-hide-edit-0":false,"signals-cond-1":"==","signals-val-1":true,"signals-icon-1":"/vis/signals/lowbattery.png","signals-icon-size-1":0,"signals-blink-1":false,"signals-horz-1":0,"signals-vert-1":0,"signals-hide-edit-1":false,"signals-cond-2":"==","signals-val-2":true,"signals-icon-2":"/vis/signals/lowbattery.png","signals-icon-size-2":0,"signals-blink-2":false,"signals-horz-2":0,"signals-vert-2":0,"signals-hide-edit-2":false,"lc-type":"last-change","lc-is-interval":true,"lc-is-moment":false,"lc-format":"","lc-position-vert":"top","lc-position-horz":"right","lc-offset-vert":0,"lc-offset-horz":0,"lc-font-size":"12px","lc-font-family":"","lc-font-style":"","lc-bkg-color":"","lc-color":"","lc-border-width":"0","lc-border-style":"","lc-border-color":"","lc-border-radius":10,"lc-zindex":0,"mdwDebug":true,"chartPaddingTop":"20","name":"WetterTrend","legendFontColor":"","xAxisValueLabelColor":"#c3bbbb","xAxisGridLinesColor":"#c3bbbb","axisLabelAutoSkip":false,"xAxisValueFontSize":"","xAxisMaxLabel":"","xAxisTitle":"","xAxisOffsetGridLines":false,"tooltipBodyAppend":"","_bubbleBindings":{},"__bindEvents":{"class":[{"name":"class"}],"backgroundColor":[{"name":"backgroundColor"}],"wid":[{"name":"wid"}]},"_bindings":3} instrument.ts:129:69
                        [JSON Chart w00114] json: {"graphs":[{"data":[{"t":1591455600000,"y":17},{"t":1591459200000,"y":17},{"t":1591462800000,"y":16},{"t":1591466400000,"y":16},{"t":1591470000000,"y":15},{"t":1591473600000,"y":14},{"t":1591477200000,"y":13},{"t":1591480800000,"y":13},{"t":1591484400000,"y":12},{"t":1591488000000,"y":12},{"t":1591491600000,"y":12},{"t":1591495200000,"y":12},{"t":1591498800000,"y":12},{"t":1591502400000,"y":12},{"t":1591506000000,"y":12},{"t":1591509600000,"y":12},{"t":1591513200000,"y":12},{"t":1591516800000,"y":12},{"t":1591520400000,"y":12},{"t":1591524000000,"y":12},{"t":1591527600000,"y":12},{"t":1591531200000,"y":13},{"t":1591534800000,"y":13},{"t":1591538400000,"y":13},{"t":1591542000000,"y":14},{"t":1591545600000,"y":14},{"t":1591549200000,"y":14},{"t":1591552800000,"y":13},{"t":1591556400000,"y":12},{"t":1591560000000,"y":12},{"t":1591563600000,"y":11},{"t":1591567200000,"y":10},{"t":1591570800000,"y":10},{"t":1591574400000,"y":9},{"t":1591578000000,"y":9},{"t":1591581600000,"y":8}],"type":"line","legendText":"Temperatur","tooltip_text":"Temperatur","tooltip_MaxDigits":1,"tooltip_AppendText":" °C","datalabel_color":["#468a00","#468a00","#338700","#338700","#208500","#0d8200","#007d06","#007d06","#00731a","#00731a","#00731a","#00731a","#00731a","#00731a","#00731a","#00731a","#00731a","#00731a","#00731a","#00731a","#00731a","#007d06","#007d06","#007d06","#0d8200","#0d8200","#0d8200","#007d06","#00731a","#00731a","#006a2d","#006040","#006040","#005653","#005653","#004d66"],"line_PointColor":["#468a00","#468a00","#338700","#338700","#208500","#0d8200","#007d06","#007d06","#00731a","#00731a","#00731a","#00731a","#00731a","#00731a","#00731a","#00731a","#00731a","#00731a","#00731a","#00731a","#00731a","#007d06","#007d06","#007d06","#0d8200","#0d8200","#0d8200","#007d06","#00731a","#00731a","#006a2d","#006040","#006040","#005653","#005653","#004d66"],"line_PointColorBorder":["#468a00","#468a00","#338700","#338700","#208500","#0d8200","#007d06","#007d06","#00731a","#00731a","#00731a","#00731a","#00731a","#00731a","#00731a","#00731a","#00731a","#00731a","#00731a","#00731a","#00731a","#007d06","#007d06","#007d06","#0d8200","#0d8200","#0d8200","#007d06","#00731a","#00731a","#006a2d","#006040","#006040","#005653","#005653","#004d66"],"yAxis_show":"false","yAxis_appendix":" °C","xAxis_timeFormats":{"millisecond":"H:mm:ss.SSS","second":"H:mm:ss","minute":"H:mm","hour":"dd.[\\n]H:mm","day":"dd[\\n]DD.MM","week":"dd[\\n]DD.MM","month":"MMM[\\n]YYYY","quarter":"[Q]Q - YYYY","year":"YYYY"}}]} instrument.ts:129:69
                        [JSON Chart w00114] graph[0]: {"data":[{"t":1591455600000,"y":17},{"t":1591459200000,"y":17},{"t":1591462800000,"y":16},{"t":1591466400000,"y":16},{"t":1591470000000,"y":15},{"t":1591473600000,"y":14},{"t":1591477200000,"y":13},{"t":1591480800000,"y":13},{"t":1591484400000,"y":12},{"t":1591488000000,"y":12},{"t":1591491600000,"y":12},{"t":1591495200000,"y":12},{"t":1591498800000,"y":12},{"t":1591502400000,"y":12},{"t":1591506000000,"y":12},{"t":1591509600000,"y":12},{"t":1591513200000,"y":12},{"t":1591516800000,"y":12},{"t":1591520400000,"y":12},{"t":1591524000000,"y":12},{"t":1591527600000,"y":12},{"t":1591531200000,"y":13},{"t":1591534800000,"y":13},{"t":1591538400000,"y":13},{"t":1591542000000,"y":14},{"t":1591545600000,"y":14},{"t":1591549200000,"y":14},{"t":1591552800000,"y":13},{"t":1591556400000,"y":12},{"t":1591560000000,"y":12},{"t":1591563600000,"y":11},{"t":1591567200000,"y":10},{"t":1591570800000,"y":10},{"t":1591574400000,"y":9},{"t":1591578000000,"y":9},{"t":1591581600000,"y":8}],"type":"line","legendText":"Temperatur","tooltip_text":"Temperatur","tooltip_MaxDigits":1,"tooltip_AppendText":" °C","datalabel_color":["#468a00","#468a00","#338700","#338700","#208500","#0d8200","#007d06","#007d06","#00731a","#00731a","#00731a","#00731a","#00731a","#00731a","#00731a","#00731a","#00731a","#00731a","#00731a","#00731a","#00731a","#007d06","#007d06","#007d06","#0d8200","#0d8200","#0d8200","#007d06","#00731a","#00731a","#006a2d","#006040","#006040","#005653","#005653","#004d66"],"line_PointColor":["#468a00","#468a00","#338700","#338700","#208500","#0d8200","#007d06","#007d06","#00731a","#00731a","#00731a","#00731a","#00731a","#00731a","#00731a","#00731a","#00731a","#00731a","#00731a","#00731a","#00731a","#007d06","#007d06","#007d06","#0d8200","#0d8200","#0d8200","#007d06","#00731a","#00731a","#006a2d","#006040","#006040","#005653","#005653","#004d66"],"line_PointColorBorder":["#468a00","#468a00","#338700","#338700","#208500","#0d8200","#007d06","#007d06","#00731a","#00731a","#00731a","#00731a","#00731a","#00731a","#00731a","#00731a","#00731a","#00731a","#00731a","#00731a","#00731a","#007d06","#007d06","#007d06","#0d8200","#0d8200","#0d8200","#007d06","#00731a","#00731a","#006a2d","#006040","#006040","#005653","#005653","#004d66"],"yAxis_show":"false","yAxis_appendix":" °C","xAxis_timeFormats":{"millisecond":"H:mm:ss.SSS","second":"H:mm:ss","minute":"H:mm","hour":"dd.[\\n]H:mm","day":"dd[\\n]DD.MM","week":"dd[\\n]DD.MM","month":"MMM[\\n]YYYY","quarter":"[Q]Q - YYYY","year":"YYYY"}} instrument.ts:129:69
                        [JSON Chart w00114] graph[0].data is data object -> using time axis instrument.ts:129:69
                        [JSON Chart w00114] graph[0].data length: 36 instrument.ts:129:69
                        [JSON Chart w00114] mydata: {"labels":[],"datasets":[{"data":[{"t":1591455600000,"y":17},{"t":1591459200000,"y":17},{"t":1591462800000,"y":16},{"t":1591466400000,"y":16},{"t":1591470000000,"y":15},{"t":1591473600000,"y":14},{"t":1591477200000,"y":13},{"t":1591480800000,"y":13},{"t":1591484400000,"y":12},{"t":1591488000000,"y":12},{"t":1591491600000,"y":12},{"t":1591495200000,"y":12},{"t":1591498800000,"y":12},{"t":1591502400000,"y":12},{"t":1591506000000,"y":12},{"t":1591509600000,"y":12},{"t":1591513200000,"y":12},{"t":1591516800000,"y":12},{"t":1591520400000,"y":12},{"t":1591524000000,"y":12},{"t":1591527600000,"y":12},{"t":1591531200000,"y":13},{"t":1591534800000,"y":13},{"t":1591538400000,"y":13},{"t":1591542000000,"y":14},{"t":1591545600000,"y":14},{"t":1591549200000,"y":14},{"t":1591552800000,"y":13},{"t":1591556400000,"y":12},{"t":1591560000000,"y":12},{"t":1591563600000,"y":11},{"t":1591567200000,"y":10},{"t":1591570800000,"y":10},{"t":1591574400000,"y":9},{"t":1591578000000,"y":9},{"t":1591581600000,"y":8}],"label":"Temperatur","type":"line","order":"0","yAxisID":"yAxis_id_0","datalabels":{"display":true,"anchor":"end","align":"top","textAlign":"center","offset":0,"clamp":true,"font":{},"color":["#468a00","#468a00","#338700","#338700","#208500","#0d8200","#007d06","#007d06","#00731a","#00731a","#00731a","#00731a","#00731a","#00731a","#00731a","#00731a","#00731a","#00731a","#00731a","#00731a","#00731a","#007d06","#007d06","#007d06","#0d8200","#0d8200","#0d8200","#007d06","#00731a","#00731a","#006a2d","#006040","#006040","#005653","#005653","#004d66"],"borderWidth":0,"borderRadius":0},"myGradientColors":{"useGradientColor":false,"gradientColors":"#44739e","useGradientFillColor":false,"gradientFillColors":"#44739e33"},"borderColor":"#44739e","steppedLine":false,"pointStyle":"circle","pointRadius":3,"pointHoverRadius":4,"pointBackgroundColor":["#468a00","#468a00","#338700","#338700","#208500","#0d8200","#007d06","#007d06","#00731a","#00731a","#00731a","#00731a","#00731a","#00731a","#00731a","#00731a","#00731a","#00731a","#00731a","#00731a","#00731a","#007d06","#007d06","#007d06","#0d8200","#0d8200","#0d8200","#007d06","#00731a","#00731a","#006a2d","#006040","#006040","#005653","#005653","#004d66"],"pointBorderColor":["#468a00","#468a00","#338700","#338700","#208500","#0d8200","#007d06","#007d06","#00731a","#00731a","#00731a","#00731a","#00731a","#00731a","#00731a","#00731a","#00731a","#00731a","#00731a","#00731a","#00731a","#007d06","#007d06","#007d06","#0d8200","#0d8200","#0d8200","#007d06","#00731a","#00731a","#006a2d","#006040","#006040","#005653","#005653","#004d66"],"pointHoverBackgroundColor":"#44739e","pointHoverBorderColor":"#44739e","spanGaps":true,"lineTension":0.4,"borderWidth":2,"fill":false,"backgroundColor":"#44739e33"}],"options":{"responsive":true,"maintainAspectRatio":false,"layout":{"padding":{"top":"20","left":0,"right":0,"bottom":0}},"hover":{"mode":"nearest"},"chartArea":{"backgroundColor":""},"scales":{"xAxes":[{"position":"bottom","scaleLabel":{"display":false,"labelString":""},"ticks":{"display":true,"autoSkip":false,"autoSkipPadding":10,"minRotation":0,"maxRotation":0,"fontColor":"#c3bbbb","padding":0},"gridLines":{"display":true,"color":"#c3bbbb","lineWidth":0.1,"drawBorder":true,"drawOnChartArea":"true","drawTicks":"true","tickMarkLength":5,"zeroLineWidth":1,"zeroLineColor":"rgba(0, 0, 0, 0.25)","offsetGridLines":false},"id":"0","display":true,"stacked":false,"type":"time","bounds":"ticks","time":{"displayFormats":{"millisecond":"H:mm:ss.SSS","second":"H:mm:ss","minute":"H:mm","hour":"dd.[\\n]H:mm","day":"dd[\\n]DD.MM","week":"dd[\\n]DD.MM","month":"MMM[\\n]YYYY","quarter":"[Q]Q - YYYY","year":"YYYY"},"tooltipFormat":"lll"}}],"yAxes":[{"id":"yAxis_id_0","type":"linear","position":"left","display":false,"stacked":false,"scaleLabel":{"display":false,"labelString":""},"ticks":{"autoSkip":true,"padding":10},"gridLines":{"display":true,"color":"black","lineWidth":0.1,"drawBorder":true,"drawOnChartArea":true,"drawTicks":true,"tickMarkLength":5,"zeroLineWidth":1,"zeroLineColor":"rgba(0, 0, 0, 0.25)"}}]},"legend":{"display":false,"position":"right","labels":{"boxWidth":10,"usePointStyle":"true","padding":10}},"tooltips":{"mode":"nearest","enabled":"true","backgroundColor":"black","caretSize":5,"caretPadding":2,"cornerRadius":4,"displayColors":true,"xPadding":10,"yPadding":10,"titleFontColor":"white","titleMarginBottom":6,"bodyFontColor":"white","callbacks":{}}}}
                        

                        achja und falls das wichtig ist, noch das Skript das den JSON erstellt

                        // imports NPM Module
                        
                        const moment = require('moment');
                        const chroma = require('chroma-js');
                        
                        moment.locale('de');
                        
                        let chart = {};
                        let values = [];
                        let axisLabels = [];
                        let colors = [];
                        
                        for (var x = 0; x <=35; x++) 
                        {
                            var state_name = "weatherunderground.0.forecastHourly." + x + "h.";
                            var temp = getState(state_name + 'temp').val;
                            var time = getState(state_name + 'time').val;    
                        
                            //console.log(Date.parse(time));
                        
                            values.push({"t": Date.parse(time), "y": temp});
                            colors.push(getColor(temp));
                        }


                        chart = {
                            graphs: [{
                                data: values,
                                type: 'line',
                                legendText: "Temperatur",
                                tooltip_text: "Temperatur",
                        		tooltip_MaxDigits: 1,
                        		tooltip_AppendText: " °C",
                                datalabel_color: colors,
                                line_PointColor: colors,
                                line_PointColorBorder: colors,
                                yAxis_show: "false",
                                yAxis_appendix: " °C",
                                xAxis_timeFormats: {
                                    millisecond: "H:mm:ss.SSS",
                                    second: "H:mm:ss",
                                    minute: "H:mm",
                                    hour: "dd.[\\n]H:mm",
                                    day: "dd[\\n]DD.MM",
                                    week: "dd[\\n]DD.MM",
                                    month: "MMM[\\n]YYYY",
                                    quarter: "[Q]Q - YYYY",
                                    year: "YYYY"
                                }
                        
                        
                            }]
                        
                        }
                        
                        setState('javascript.0.vorhersage.json', JSON.stringify(chart), true);
                        
                        function getColor(temp) {
                        
                            let scale = chroma.scale(['blue', 'green', 'orange', 'red']);
                         
                            let tempMax = 30;
                            let tempMin = -10;
                        
                         
                            if (temp > tempMax) {
                        
                                return scale(1).hex();
                        
                            } else if (temp < tempMin) {
                        
                                return scale(0).hex();
                        
                            } else {
                        
                                return scale(temp / (tempMax - tempMin)).hex();
                        
                            }
                        
                        }


                        Danke an alle, bei denen ich geklaut habe 😉

                        Boronsbruder 1 Reply Last reply Reply Quote 0
                        • Boronsbruder
                          Boronsbruder @Boronsbruder last edited by Boronsbruder

                          Also, das mit dem leeren Tooltip konnte ich lösen:

                          tooltip_text: "Temperatur",
                          

                          in

                          tooltip_title: "Temperatur",
                          

                          geändert.

                          Als ich zum Testen noch

                                  xAxis_tooltip_timeFormats: {
                                      millisecond: "H:mm:ss.SSS",
                                      second: "H:mm:ss",
                                      minute: "H:mm",
                                      hour: "dd.[\\n]H:mm",
                                      day: "dd[\\n]DD.MM",
                                      week: "dd[\\n]DD.MM",
                                      month: "MMM[\\n]YYYY",
                                      quarter: "[Q]Q - YYYY",
                                      year: "YYYY"
                                  },
                          

                          eingefügt habe, tauchten in der Firefox Konsole folgende Fehler auf:

                          TypeError: e.replace is not a function       moment-with-locales.min.js:28:5029
                          
                              F                 moment-with-locales.min.js:28
                              A                 moment-with-locales.min.js:28
                              format            moment-with-locales.min.js:28
                              format            lib.min.js:6
                              getLabelForIndex  lib.min.js:6
                              At                lib.min.js:1
                              update            lib.min.js:4
                              handleEvent       lib.min.js:4
                              eventHandler      lib.min.js:4
                              n                 lib.min.js:4
                              <anonym>          lib.min.js:4
                              sentryWrapped     helpers.ts:85


                          TypeError: e.title is undefined2                              lib.min.js:4:18453
                              draw               https://192.168.116.246:8582/vis/widgets/materialdesign/lib.min.js:4
                              _drawTooltip       https://192.168.116.246:8582/vis/widgets/materialdesign/lib.min.js:4
                              draw               https://192.168.116.246:8582/vis/widgets/materialdesign/lib.min.js:4
                              render             https://192.168.116.246:8582/vis/widgets/materialdesign/lib.min.js:4
                              callback           https://192.168.116.246:8582/vis/widgets/materialdesign/lib.min.js:2
                              advance            https://192.168.116.246:8582/vis/widgets/materialdesign/lib.min.js:3
                              startDigest        https://192.168.116.246:8582/vis/widgets/materialdesign/lib.min.js:3
                              request            https://192.168.116.246:8582/vis/widgets/materialdesign/lib.min.js:3
                          

                          und es wird kein Tooltip mehr angezeigt.

                          Ob das damit zusammenhängt? keine Ahnung

                          Boronsbruder 1 Reply Last reply Reply Quote 0
                          • Boronsbruder
                            Boronsbruder @Boronsbruder last edited by

                            Die Firefoxfehler hab ich jetzt auch weg:
                            Wer lesen kann ist klar im Vorteil....
                            xAxis_tooltip_timeFormats "type" ist halt "string" und nicht "object"...

                            Aber das Hauptproblen, dass die Wochentage nicht mehr angezeigt werden, besteht leider immer noch...

                            1 Reply Last reply Reply Quote 0
                            • Boronsbruder
                              Boronsbruder last edited by

                              So, wieder einen Schritt weiter...

                              Nach dem ich den Eintrag bei xAxis_tooltip_timeFormats -> minute: in "dd.[\n]H:mm" geändert habe, ist meine Beschriftung wieder im richtigen Format.

                              Warum er aber nun das "Minute"-Format nutzt, erschließt sich mir nicht, da die Abstände der Timestamps immer noch stündlich sind.

                              Was aber leider immer noch nicht funktionert ist, daß er jetzt die Beschriftung nicht mehr im 2-stündlichen Abstand schreibt, sondern jede Stunde.
                              Der Haken bei "Automatische Überspringen von Beschriftungen auf der X-Achse" macht keinen Unterschied.

                              Was mir auch noch aufgefallen ist, dass die Beschriftung nicht mehr "synchron" zu den Daten ist, wenn man im Widget nicht explizit die "maximale Anzahl der Beschriftungen" festlegt!

                              Ohne Eintrag:
                              unsync.JPG

                              Mit maximale Anzahl der Achsenbeschriftung -> 35:
                              sync.JPG

                              P.S. ist der Thread hier eigentlich tot, oder interessiert das nur niemand 😂

                              Scrounger 2 Replies Last reply Reply Quote 0
                              • Scrounger
                                Scrounger Developer @Boronsbruder last edited by

                                @Boronsbruder
                                Ne nicht tot, hab immer die Hoffnung das auch jemand anderes antwortet 😉

                                Poste mal den json string für den Chart, dann schau ich es mir an.

                                Boronsbruder 1 Reply Last reply Reply Quote 0
                                • Boronsbruder
                                  Boronsbruder @Scrounger last edited by

                                  @Scrounger

                                  {"graphs":[{"data":[{"t":1592676000000,"y":18},{"t":1592679600000,"y":16},{"t":1592683200000,"y":15},{"t":1592686800000,"y":14},{"t":1592690400000,"y":14},{"t":1592694000000,"y":13},{"t":1592697600000,"y":12},{"t":1592701200000,"y":12},{"t":1592704800000,"y":12},{"t":1592708400000,"y":11},{"t":1592712000000,"y":11},{"t":1592715600000,"y":13},{"t":1592719200000,"y":15},{"t":1592722800000,"y":17},{"t":1592726400000,"y":18},{"t":1592730000000,"y":19},{"t":1592733600000,"y":19},{"t":1592737200000,"y":20},{"t":1592740800000,"y":21},{"t":1592744400000,"y":21},{"t":1592748000000,"y":21},{"t":1592751600000,"y":21},{"t":1592755200000,"y":21},{"t":1592758800000,"y":21},{"t":1592762400000,"y":20},{"t":1592766000000,"y":18},{"t":1592769600000,"y":17},{"t":1592773200000,"y":16},{"t":1592776800000,"y":15},{"t":1592780400000,"y":15},{"t":1592784000000,"y":14},{"t":1592787600000,"y":14},{"t":1592791200000,"y":14},{"t":1592794800000,"y":14},{"t":1592798400000,"y":14},{"t":1592802000000,"y":15}],"type":"line","legendText":"","tooltip_title":"Temperatur","tooltip_MaxDigits":2,"tooltip_AppendText":" °C","datalabel_color":["#598d00","#338700","#208500","#0d8200","#0d8200","#007d06","#00731a","#00731a","#00731a","#006a2d","#006a2d","#007d06","#208500","#468a00","#598d00","#6c9000","#6c9000","#809300","#939500","#939500","#939500","#939500","#939500","#939500","#809300","#598d00","#468a00","#338700","#208500","#208500","#0d8200","#0d8200","#0d8200","#0d8200","#0d8200","#208500"],"line_PointColor":["#598d00","#338700","#208500","#0d8200","#0d8200","#007d06","#00731a","#00731a","#00731a","#006a2d","#006a2d","#007d06","#208500","#468a00","#598d00","#6c9000","#6c9000","#809300","#939500","#939500","#939500","#939500","#939500","#939500","#809300","#598d00","#468a00","#338700","#208500","#208500","#0d8200","#0d8200","#0d8200","#0d8200","#0d8200","#208500"],"line_PointColorBorder":["#598d00","#338700","#208500","#0d8200","#0d8200","#007d06","#00731a","#00731a","#00731a","#006a2d","#006a2d","#007d06","#208500","#468a00","#598d00","#6c9000","#6c9000","#809300","#939500","#939500","#939500","#939500","#939500","#939500","#809300","#598d00","#468a00","#338700","#208500","#208500","#0d8200","#0d8200","#0d8200","#0d8200","#0d8200","#208500"],"yAxis_show":"false","yAxis_appendix":" °C","xAxis_timeFormats":{"millisecond":"H:mm:ss.SSS","second":"H:mm:ss","minute":"dd.[\\n]H","hour":"dd.[\\n]H:mm","day":"dd[\\n]DD.MM","week":"dd[\\n]DD.MM","month":"MMM[\\n]YYYY","quarter":"[Q]Q - YYYY","year":"YYYY"}}]}
                                  

                                  Das ist er.
                                  Dank dir schon mal im Vorraus 😉

                                  1 Reply Last reply Reply Quote 0
                                  • Scrounger
                                    Scrounger Developer @Boronsbruder last edited by Scrounger

                                    @Boronsbruder sagte in Material Design Widgets: JSON Chart Widget:

                                    Warum er aber nun das "Minute"-Format nutzt, erschließt sich mir nicht, da die Abstände der Timestamps immer noch stündlich sind.

                                    Weil die API immer versucht die Achse optimal zu erstellen. Wenn du jetzt wieder Minuten im timeformat aktivierst, siehst du das die Achsenschritte in Minuten sind.

                                    Was aber leider immer noch nicht funktionert ist, daß er jetzt die Beschriftung nicht mehr im 2-stündlichen Abstand schreibt, sondern jede Stunde.

                                    Bei 35 Werten (= Stunden) alle zwei Stunden anzeigen, muss du bei maximale Anzahl der Beschriftung die Hälfte eintragen, also 17 / 18 Kommawerte gehen nicht.

                                    Der Haken bei "Automatische Überspringen von Beschriftungen auf der X-Achse" macht keinen Unterschied.

                                    Was mir auch noch aufgefallen ist, dass die Beschriftung nicht mehr "synchron" zu den Daten ist, wenn man im Widget nicht explizit die "maximale Anzahl der Beschriftungen" festlegt!

                                    Ohne Eintrag:
                                    unsync.JPG

                                    Mit maximale Anzahl der Achsenbeschriftung -> 35:
                                    sync.JPG

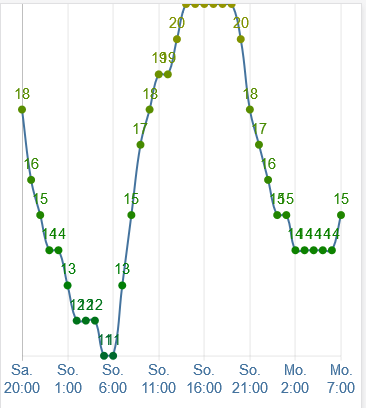
                                    Gleiche Ursache wie oben, er nimmt hier Minute aber du blendest sie aus.
                                    Hier mal zwei screenshots dazu:
                                    84a81701-c240-48e2-a1f0-c6b6d156b187-grafik.png 5b2610a6-58f6-4cb0-a522-83cc115f7dbd-grafik.png

                                    Wie du erkennst passt er je nach Größe automatisch die Achse an.

                                    So jetzt noch die gute Nachricht. Hab noch eine Möglichkeit in der API entdeckt, wodurch das besser geht. Ist in der kommenden Verison enthalten.

                                    Boronsbruder 1 Reply Last reply Reply Quote 1
                                    • Boronsbruder
                                      Boronsbruder @Scrounger last edited by Boronsbruder

                                      @Scrounger
                                      Danke für die Infos!

                                      Kann ich der Api vorgeben, ob ich stündlich oder minütlich haben will?
                                      Vorher war die Darstellung ja so:

                                      Vor den Updates
                                      88356173-6acd-4535-abad-1f6b2a0098a3-grafik.png

                                      Scrounger 1 Reply Last reply Reply Quote 0
                                      • Scrounger
                                        Scrounger Developer @Boronsbruder last edited by

                                        @Boronsbruder sagte in Material Design Widgets: JSON Chart Widget:

                                        Kann ich der Api vorgeben, ob ich stündlich oder minütlich haben will?

                                        Ja die API bietet die Möglichkeit, gibt aber verschiedene Gründe warum ich das nicht einbauen möchte. Macht die Einstellungen für die User nochmals komplizierter.

                                        1 Reply Last reply Reply Quote 0
                                        • S
                                          shortcircuit0815 last edited by

                                          Hi zusammen,
                                          ich versuche aus o.g. Beispiel ein bar chart zu erstellen, welches als grouped bar dargestellt wird. In meinem Fall also Energiewerte der PV-Anlage pro Tag innerhalb einer Woche. Dazu müssen Produktion, Einkauf, Verkauf, etc. gruppiert angezeigt werden. Funktioniert das überhaupt? Anhand der Doku hier lässt sich vermuten, dass es zumindest noch nicht möglich ist.

                                          Scrounger 1 Reply Last reply Reply Quote 0
                                          • Scrounger
                                            Scrounger Developer @shortcircuit0815 last edited by Scrounger

                                            @shortcircuit0815 sagte in Material Design Widgets: JSON Chart Widget:

                                            Hi zusammen,
                                            ich versuche aus o.g. Beispiel ein bar chart zu erstellen, welches als grouped bar dargestellt wird.

                                            Das geht bereits, nennt sich allerdings stacked bar chart:

                                            63959c22-c55e-4b93-885b-9a8aa1a63022-grafik.png

                                            S 1 Reply Last reply Reply Quote 0
                                            • First post
                                              Last post

                                            Support us

                                            ioBroker
                                            Community Adapters
                                            Donate

                                            813
                                            Online

                                            31.7k
                                            Users

                                            79.7k
                                            Topics

                                            1.3m
                                            Posts

                                            vis
                                            36
                                            190
                                            27169
                                            Loading More Posts
                                            • Oldest to Newest
                                            • Newest to Oldest
                                            • Most Votes
                                            Reply
                                            • Reply as topic
                                            Log in to reply
                                            Community
                                            Impressum | Datenschutz-Bestimmungen | Nutzungsbedingungen
                                            The ioBroker Community 2014-2023
                                            logo