VIS von Sigi234
-
Jupp, sind mm
-
@sigi234
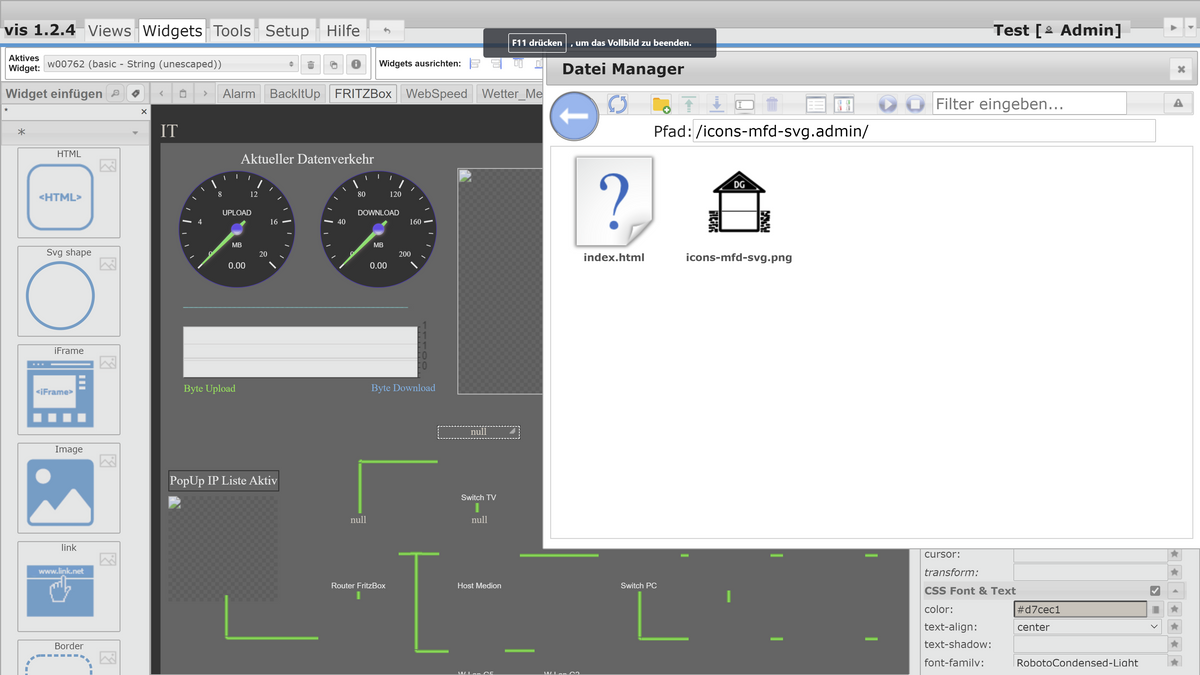
Im Dateimanager kann ich die SVG Icons nicht sehen, im Ordner MFD-PNG diese schon. Wenn ich mit FileZilla auf den Ordner gehe sind diese jedoch da. Allerdings kann ich Sie über den Dateimanager nicht erneut hochladen. -
Ohne alles gelesen, geteste oder sonst was zu haben schließe ich mich der Begeisterung uneingeschränkt an:
SEHR geil! -
@Schwabe
Die sind auch nicht im Admin Ordner.
Hochladen kannst du nur unter vis.0 -
@Schorlewalker sagte in VIS von Sigi234:
Ohne alles gelesen, geteste oder sonst was zu haben schließe ich mich der Begeisterung uneingeschränkt an:
SEHR geil!Danke, ist für jeden was dabei.

Es sind ja nur Vorlagen, die man aber an das eigene Design anpassen kann. -
@sigi234 Hallo, wäre es auch möglich die Bilder für die View fb-checkpresence Anwesend/Abwesend zu bekommen?
Danke -
@Holger-Etzel sagte in VIS von Sigi234:
@sigi234 Hallo, wäre es auch möglich die Bilder für die View fb-checkpresence Anwesend/Abwesend zu bekommen?
DankeDie sind bei einen Icon Set dabei. Kann jetzt nicht nachsehen wie sie heißen. Brauchst aber nur auswählen und oben links auf das Info Icon klicken und dann ev. nachinstallieren.
icons-mfd-svg
-
Hallo zusammen,
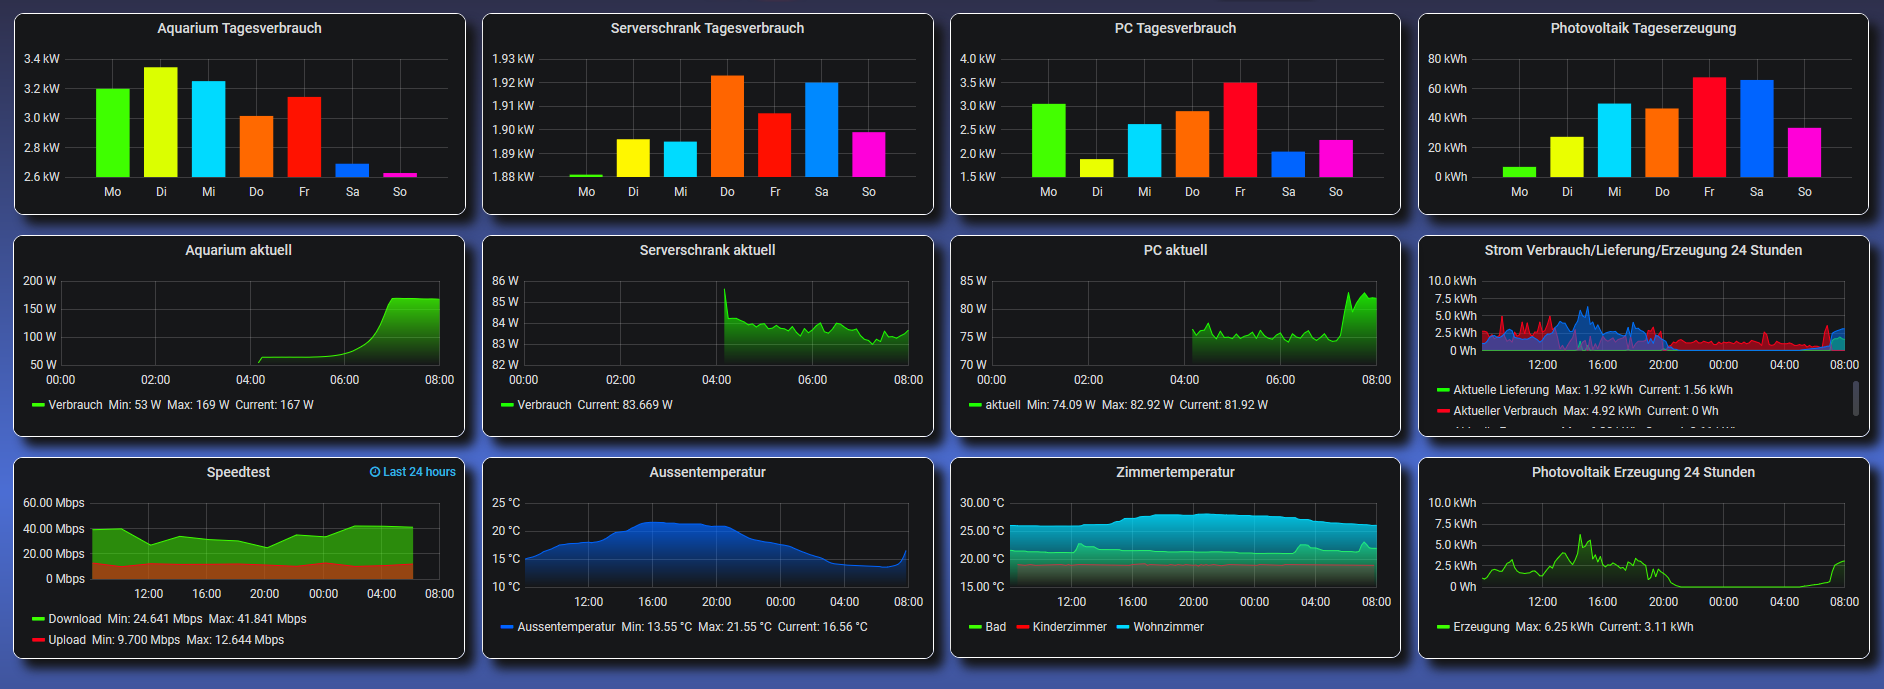
ich suche ne schöne View für meinen Stromverbrauch, vieleiht hat da ja jemand was für mich
")
-
@Malz1902 sagte in VIS von Sigi234:
ich suche ne schöne View für meinen Stromverbrauch
Ich visualisiere das mit Grafana.
Geht aber auch mit Flot.
Und dann die einzelnen Flots als Iframe einbinden.
-
Du bringst mich gerade auf ne Super Idee den Stromverbrauch für den Serverschrank auch noch zu splitten. Nutzt du dafür nen extra Zähler oder wie machst Du das?
-
@Malz1902 sagte in VIS von Sigi234:
Nutzt du dafür nen extra Zähler oder wie machst Du das?
mit den TP-Link HS110 Steckdosen
-
@Negalein sagte in VIS von Sigi234:
@Malz1902 sagte in VIS von Sigi234:
ich suche ne schöne View für meinen Stromverbrauch
Ich visualisiere das mit Grafana.
Geht aber auch mit Flot.
Und dann die einzelnen Flots als Iframe einbinden.
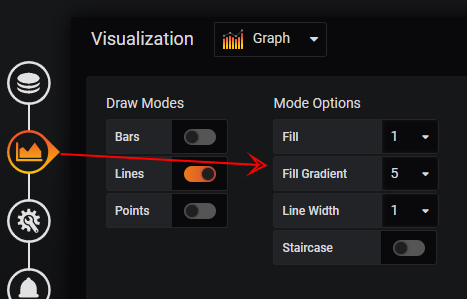
Sieht sehr gut aus, ich nutze selber auch grafana. Wie stellst du die auslaufende Füllfarbe ein?
-
@saeft_2003 sagte in VIS von Sigi234:
Wie stellst du die auslaufende Füllfarbe ein?
mit einer Kombi aus Fill und Fill Gradient
Sieht sehr gut aus
Danke
-
Ok danke für die Info, dass muss ich heute Abend mal ausprobieren!
-
@sigi234 sagte in VIS von Sigi234:
View backitup:
Hallo Sigi, mega VIS die du da hast. Da sie mir so gut gefällt wollte ich die Backup vis übernehmen aber bei mir funktioniert der Animations-Balken nicht. Brauche ich dafür eine spezielle Instanz?
Grüße
-
@Bluelinux sagte in VIS von Sigi234:
@sigi234 sagte in VIS von Sigi234:
View backitup:
Hallo Sigi, mega VIS die du da hast. Da sie mir so gut gefällt wollte ich die Backup vis übernehmen aber bei mir funktioniert der Animations-Balken nicht. Brauche ich dafür eine spezielle Instanz?
Grüße
https://forum.iobroker.net/topic/30363/projekt-mdcss-v2-material-design-css-version-2
-
@sigi234 danke, habs gefunden
-
@Negalein welches Plugin ist das bei Grafana? hab da auch erst mit angefangen.. kannst du mir die am besten exportieren, dann kann ich schauen wie das eingestellt ist.. auch mit den Wochentagen.. ???
-
@ilovegym sagte in VIS von Sigi234:
welches Plugin ist das bei Grafana? hab da auch erst mit angefangen.. kannst du mir die am besten exportieren, dann kann ich schauen wie das eingestellt ist.. auch mit den Wochentagen.. ???
Das mit den Wochentagen ist mit dem Graph Panel gemacht.
Ich hab dir mal das ganze Dashboard exportiert. Hoffe es hat geklappt.
{ "annotations": { "list": [ { "builtIn": 1, "datasource": "-- Grafana --", "enable": true, "hide": true, "iconColor": "rgba(0, 211, 255, 1)", "name": "Annotations & Alerts", "type": "dashboard" } ] }, "editable": true, "gnetId": null, "graphTooltip": 0, "id": 2, "links": [], "panels": [ { "aliasColors": { "Di": "rgb(255, 247, 0)", "Dienstag": "rgb(255, 221, 0)", "Do": "rgb(255, 101, 0)", "Donnerstag": "rgb(255, 126, 0)", "Fr": "rgb(255, 16, 0)", "Freitag": "rgb(255, 0, 31)", "Mi": "rgb(0, 219, 255)", "Mittwoch": "rgb(0, 100, 255)", "Mo": "rgb(63, 255, 0)", "Montag": "rgb(61, 255, 0)", "Sa": "rgb(0, 137, 255)", "Samstag": "rgb(0, 95, 255)", "So": "rgb(255, 0, 218)", "Sonntag": "rgb(255, 0, 215)" }, "bars": true, "dashLength": 10, "dashes": false, "datasource": null, "fill": 1, "fillGradient": 0, "gridPos": { "h": 7, "w": 7, "x": 0, "y": 0 }, "hiddenSeries": false, "hideTimeOverride": true, "id": 24, "interval": "", "legend": { "avg": false, "current": false, "max": false, "min": false, "show": false, "total": false, "values": false }, "lines": false, "linewidth": 1, "nullPointMode": "connected", "options": { "dataLinks": [] }, "percentage": false, "pluginVersion": "6.6.2", "pointradius": 2, "points": false, "renderer": "flot", "seriesOverrides": [], "spaceLength": 10, "stack": false, "steppedLine": false, "targets": [ { "alias": "Mo", "groupBy": [ { "params": [ "$__interval" ], "type": "time" }, { "params": [ "null" ], "type": "fill" } ], "measurement": "sourceanalytix.0.hs100__0__10_0_1_80__power.consumption.current_year.this_week.01_Monday", "orderByTime": "ASC", "policy": "default", "refId": "A", "resultFormat": "time_series", "select": [ [ { "params": [ "value" ], "type": "field" }, { "params": [], "type": "mean" } ] ], "tags": [] }, { "alias": "Di", "groupBy": [ { "params": [ "$__interval" ], "type": "time" }, { "params": [ "null" ], "type": "fill" } ], "measurement": "sourceanalytix.0.hs100__0__10_0_1_80__power.consumption.current_year.this_week.02_Tuesday", "orderByTime": "ASC", "policy": "default", "refId": "B", "resultFormat": "time_series", "select": [ [ { "params": [ "value" ], "type": "field" }, { "params": [], "type": "mean" } ] ], "tags": [] }, { "alias": "Mi", "groupBy": [ { "params": [ "$__interval" ], "type": "time" }, { "params": [ "null" ], "type": "fill" } ], "measurement": "sourceanalytix.0.hs100__0__10_0_1_80__power.consumption.current_year.this_week.03_Wednesday", "orderByTime": "ASC", "policy": "default", "refId": "C", "resultFormat": "time_series", "select": [ [ { "params": [ "value" ], "type": "field" }, { "params": [], "type": "mean" } ] ], "tags": [] }, { "alias": "Do", "groupBy": [ { "params": [ "$__interval" ], "type": "time" }, { "params": [ "null" ], "type": "fill" } ], "measurement": "sourceanalytix.0.hs100__0__10_0_1_80__power.consumption.current_year.this_week.04_Thursday", "orderByTime": "ASC", "policy": "default", "refId": "D", "resultFormat": "time_series", "select": [ [ { "params": [ "value" ], "type": "field" }, { "params": [], "type": "mean" } ] ], "tags": [] }, { "alias": "Fr", "groupBy": [ { "params": [ "$__interval" ], "type": "time" }, { "params": [ "null" ], "type": "fill" } ], "measurement": "sourceanalytix.0.hs100__0__10_0_1_80__power.consumption.current_year.this_week.05_Friday", "orderByTime": "ASC", "policy": "default", "refId": "E", "resultFormat": "time_series", "select": [ [ { "params": [ "value" ], "type": "field" }, { "params": [], "type": "mean" } ] ], "tags": [] }, { "alias": "Sa", "groupBy": [ { "params": [ "$__interval" ], "type": "time" }, { "params": [ "null" ], "type": "fill" } ], "measurement": "sourceanalytix.0.hs100__0__10_0_1_80__power.consumption.current_year.this_week.06_Saturday", "orderByTime": "ASC", "policy": "default", "refId": "F", "resultFormat": "time_series", "select": [ [ { "params": [ "value" ], "type": "field" }, { "params": [], "type": "mean" } ] ], "tags": [] }, { "alias": "So", "groupBy": [ { "params": [ "$__interval" ], "type": "time" }, { "params": [ "null" ], "type": "fill" } ], "measurement": "sourceanalytix.0.hs100__0__10_0_1_80__power.consumption.current_year.this_week.07_Sunday", "orderByTime": "ASC", "policy": "default", "refId": "G", "resultFormat": "time_series", "select": [ [ { "params": [ "value" ], "type": "field" }, { "params": [], "type": "mean" } ] ], "tags": [] } ], "thresholds": [], "timeFrom": "7d", "timeRegions": [], "timeShift": null, "title": "Serverschrank Tagesverbrauch", "tooltip": { "shared": false, "sort": 0, "value_type": "individual" }, "transparent": true, "type": "graph", "xaxis": { "buckets": null, "mode": "series", "name": null, "show": true, "values": [ "max" ] }, "yaxes": [ { "format": "kwatt", "label": null, "logBase": 1, "max": null, "min": null, "show": true }, { "format": "short", "label": null, "logBase": 1, "max": null, "min": null, "show": false } ], "yaxis": { "align": false, "alignLevel": null } }, { "aliasColors": { "Di": "rgb(219, 255, 0)", "Do": "rgb(255, 105, 0)", "Fr": "rgb(255, 18, 0)", "Mi": "rgb(0, 218, 255)", "Mo": "rgb(63, 255, 0)", "Sa": "rgb(0, 101, 255)", "So": "rgb(255, 0, 211)", "Tagesverbrauch": "dark-blue" }, "bars": true, "dashLength": 10, "dashes": false, "datasource": null, "fill": 1, "fillGradient": 0, "gridPos": { "h": 7, "w": 7, "x": 7, "y": 0 }, "hiddenSeries": false, "hideTimeOverride": true, "id": 20, "legend": { "alignAsTable": false, "avg": false, "current": false, "hideEmpty": false, "hideZero": false, "max": false, "min": false, "show": false, "total": false, "values": false }, "lines": false, "linewidth": 1, "nullPointMode": "connected", "options": { "dataLinks": [] }, "percentage": false, "pluginVersion": "6.6.2", "pointradius": 6, "points": false, "renderer": "flot", "seriesOverrides": [], "spaceLength": 10, "stack": false, "steppedLine": false, "targets": [ { "alias": "Mo", "groupBy": [ { "params": [ "$__interval" ], "type": "time" }, { "params": [ "null" ], "type": "fill" } ], "measurement": "sourceanalytix.0.hs100__0__10_0_1_77__power.consumption.current_year.this_week.01_Monday", "orderByTime": "ASC", "policy": "default", "refId": "A", "resultFormat": "time_series", "select": [ [ { "params": [ "value" ], "type": "field" }, { "params": [], "type": "mean" } ] ], "tags": [] }, { "alias": "Di", "groupBy": [ { "params": [ "$__interval" ], "type": "time" }, { "params": [ "null" ], "type": "fill" } ], "measurement": "sourceanalytix.0.hs100__0__10_0_1_77__power.consumption.current_year.this_week.02_Tuesday", "orderByTime": "ASC", "policy": "default", "refId": "B", "resultFormat": "time_series", "select": [ [ { "params": [ "value" ], "type": "field" }, { "params": [], "type": "mean" } ] ], "tags": [] }, { "alias": "Mi", "groupBy": [ { "params": [ "$__interval" ], "type": "time" }, { "params": [ "null" ], "type": "fill" } ], "measurement": "sourceanalytix.0.hs100__0__10_0_1_77__power.consumption.current_year.this_week.03_Wednesday", "orderByTime": "ASC", "policy": "default", "refId": "C", "resultFormat": "time_series", "select": [ [ { "params": [ "value" ], "type": "field" }, { "params": [], "type": "mean" } ] ], "tags": [] }, { "alias": "Do", "groupBy": [ { "params": [ "$__interval" ], "type": "time" }, { "params": [ "null" ], "type": "fill" } ], "measurement": "sourceanalytix.0.hs100__0__10_0_1_77__power.consumption.current_year.this_week.04_Thursday", "orderByTime": "ASC", "policy": "default", "refId": "D", "resultFormat": "time_series", "select": [ [ { "params": [ "value" ], "type": "field" }, { "params": [], "type": "mean" } ] ], "tags": [] }, { "alias": "Fr", "groupBy": [ { "params": [ "$__interval" ], "type": "time" }, { "params": [ "null" ], "type": "fill" } ], "measurement": "sourceanalytix.0.hs100__0__10_0_1_77__power.consumption.current_year.this_week.05_Friday", "orderByTime": "ASC", "policy": "default", "refId": "E", "resultFormat": "time_series", "select": [ [ { "params": [ "value" ], "type": "field" }, { "params": [], "type": "mean" } ] ], "tags": [] }, { "alias": "Sa", "groupBy": [ { "params": [ "$__interval" ], "type": "time" }, { "params": [ "null" ], "type": "fill" } ], "measurement": "sourceanalytix.0.hs100__0__10_0_1_77__power.consumption.current_year.this_week.06_Saturday", "orderByTime": "ASC", "policy": "default", "refId": "F", "resultFormat": "time_series", "select": [ [ { "params": [ "value" ], "type": "field" }, { "params": [], "type": "mean" } ] ], "tags": [] }, { "alias": "So", "groupBy": [ { "params": [ "$__interval" ], "type": "time" }, { "params": [ "null" ], "type": "fill" } ], "measurement": "sourceanalytix.0.hs100__0__10_0_1_77__power.consumption.current_year.this_week.07_Sunday", "orderByTime": "ASC", "policy": "default", "refId": "G", "resultFormat": "time_series", "select": [ [ { "params": [ "value" ], "type": "field" }, { "params": [], "type": "mean" } ] ], "tags": [] } ], "thresholds": [], "timeFrom": "7d", "timeRegions": [], "timeShift": null, "title": "Aquarium Tagesverbrauch", "tooltip": { "shared": false, "sort": 0, "value_type": "individual" }, "transparent": true, "type": "graph", "xaxis": { "buckets": null, "mode": "series", "name": null, "show": true, "values": [ "max" ] }, "yaxes": [ { "format": "kwatt", "label": "", "logBase": 1, "max": null, "min": null, "show": true }, { "format": "short", "label": null, "logBase": 1, "max": null, "min": null, "show": false } ], "yaxis": { "align": true, "alignLevel": 0 } }, { "aliasColors": { "Di": "rgb(234, 255, 0)", "Do": "rgb(255, 105, 0)", "Fr": "rgb(255, 0, 29)", "Mi": "rgb(0, 219, 255)", "Mo": "rgb(67, 255, 0)", "Sa": "rgb(0, 100, 255)", "So": "rgb(255, 0, 216)" }, "bars": true, "dashLength": 10, "dashes": false, "datasource": null, "fill": 1, "fillGradient": 0, "gridPos": { "h": 7, "w": 7, "x": 14, "y": 0 }, "hiddenSeries": false, "hideTimeOverride": true, "id": 16, "legend": { "alignAsTable": false, "avg": false, "current": false, "hideEmpty": false, "hideZero": false, "max": false, "min": false, "show": false, "total": false, "values": false }, "lines": false, "linewidth": 1, "nullPointMode": "connected", "options": { "dataLinks": [] }, "percentage": false, "pointradius": 2, "points": false, "renderer": "flot", "seriesOverrides": [], "spaceLength": 10, "stack": false, "steppedLine": false, "targets": [ { "alias": "Mo", "groupBy": [ { "params": [ "$__interval" ], "type": "time" }, { "params": [ "null" ], "type": "fill" } ], "measurement": "sourceanalytix.0.hs100__0__10_0_1_79__power.consumption.current_year.this_week.01_Monday", "orderByTime": "ASC", "policy": "default", "refId": "A", "resultFormat": "time_series", "select": [ [ { "params": [ "value" ], "type": "field" }, { "params": [], "type": "mean" } ] ], "tags": [] }, { "alias": "Di", "groupBy": [ { "params": [ "$__interval" ], "type": "time" }, { "params": [ "null" ], "type": "fill" } ], "measurement": "sourceanalytix.0.hs100__0__10_0_1_79__power.consumption.current_year.this_week.02_Tuesday", "orderByTime": "ASC", "policy": "default", "refId": "B", "resultFormat": "time_series", "select": [ [ { "params": [ "value" ], "type": "field" }, { "params": [], "type": "mean" } ] ], "tags": [] }, { "alias": "Mi", "groupBy": [ { "params": [ "$__interval" ], "type": "time" }, { "params": [ "null" ], "type": "fill" } ], "measurement": "sourceanalytix.0.hs100__0__10_0_1_79__power.consumption.current_year.this_week.03_Wednesday", "orderByTime": "ASC", "policy": "default", "refId": "C", "resultFormat": "time_series", "select": [ [ { "params": [ "value" ], "type": "field" }, { "params": [], "type": "mean" } ] ], "tags": [] }, { "alias": "Do", "groupBy": [ { "params": [ "$__interval" ], "type": "time" }, { "params": [ "null" ], "type": "fill" } ], "measurement": "sourceanalytix.0.hs100__0__10_0_1_79__power.consumption.current_year.this_week.04_Thursday", "orderByTime": "ASC", "policy": "default", "refId": "D", "resultFormat": "time_series", "select": [ [ { "params": [ "value" ], "type": "field" }, { "params": [], "type": "mean" } ] ], "tags": [] }, { "alias": "Fr", "groupBy": [ { "params": [ "$__interval" ], "type": "time" }, { "params": [ "null" ], "type": "fill" } ], "measurement": "sourceanalytix.0.hs100__0__10_0_1_79__power.consumption.current_year.this_week.05_Friday", "orderByTime": "ASC", "policy": "default", "refId": "E", "resultFormat": "time_series", "select": [ [ { "params": [ "value" ], "type": "field" }, { "params": [], "type": "mean" } ] ], "tags": [] }, { "alias": "Sa", "groupBy": [ { "params": [ "$__interval" ], "type": "time" }, { "params": [ "null" ], "type": "fill" } ], "measurement": "sourceanalytix.0.hs100__0__10_0_1_79__power.consumption.current_year.this_week.06_Saturday", "orderByTime": "ASC", "policy": "default", "refId": "F", "resultFormat": "time_series", "select": [ [ { "params": [ "value" ], "type": "field" }, { "params": [], "type": "mean" } ] ], "tags": [] }, { "alias": "So", "groupBy": [ { "params": [ "$__interval" ], "type": "time" }, { "params": [ "null" ], "type": "fill" } ], "measurement": "sourceanalytix.0.hs100__0__10_0_1_79__power.consumption.current_year.this_week.07_Sunday", "orderByTime": "ASC", "policy": "default", "refId": "G", "resultFormat": "time_series", "select": [ [ { "params": [ "value" ], "type": "field" }, { "params": [], "type": "mean" } ] ], "tags": [] } ], "thresholds": [], "timeFrom": "7d", "timeRegions": [], "timeShift": null, "title": "PC Tagesverbrauch", "tooltip": { "shared": false, "sort": 0, "value_type": "individual" }, "transparent": true, "type": "graph", "xaxis": { "buckets": null, "mode": "series", "name": null, "show": true, "values": [ "max" ] }, "yaxes": [ { "format": "kwatt", "label": null, "logBase": 1, "max": null, "min": null, "show": true }, { "format": "short", "label": null, "logBase": 1, "max": null, "min": null, "show": false } ], "yaxis": { "align": false, "alignLevel": null } }, { "aliasColors": { "Di": "rgb(234, 255, 0)", "Do": "rgb(255, 105, 0)", "Fr": "rgb(255, 0, 29)", "Mi": "rgb(0, 219, 255)", "Mo": "rgb(67, 255, 0)", "Sa": "rgb(0, 100, 255)", "So": "rgb(255, 0, 216)" }, "bars": true, "dashLength": 10, "dashes": false, "datasource": null, "fill": 1, "fillGradient": 0, "gridPos": { "h": 7, "w": 7, "x": 0, "y": 7 }, "hiddenSeries": false, "hideTimeOverride": true, "id": 27, "legend": { "alignAsTable": false, "avg": false, "current": false, "hideEmpty": false, "hideZero": false, "max": false, "min": false, "show": false, "total": false, "values": false }, "lines": false, "linewidth": 1, "nullPointMode": "connected", "options": { "dataLinks": [] }, "percentage": false, "pointradius": 2, "points": false, "renderer": "flot", "seriesOverrides": [], "spaceLength": 10, "stack": false, "steppedLine": false, "targets": [ { "alias": "Mo", "groupBy": [ { "params": [ "$__interval" ], "type": "time" }, { "params": [ "null" ], "type": "fill" } ], "measurement": "sourceanalytix.0.fronius__0__inverter__1__PAC.consumption.current_year.this_week.01_Monday", "orderByTime": "ASC", "policy": "default", "refId": "A", "resultFormat": "time_series", "select": [ [ { "params": [ "value" ], "type": "field" }, { "params": [], "type": "mean" } ] ], "tags": [] }, { "alias": "Di", "groupBy": [ { "params": [ "$__interval" ], "type": "time" }, { "params": [ "null" ], "type": "fill" } ], "measurement": "sourceanalytix.0.fronius__0__inverter__1__PAC.consumption.current_year.this_week.02_Tuesday", "orderByTime": "ASC", "policy": "default", "refId": "B", "resultFormat": "time_series", "select": [ [ { "params": [ "value" ], "type": "field" }, { "params": [], "type": "mean" } ] ], "tags": [] }, { "alias": "Mi", "groupBy": [ { "params": [ "$__interval" ], "type": "time" }, { "params": [ "null" ], "type": "fill" } ], "measurement": "sourceanalytix.0.fronius__0__inverter__1__PAC.consumption.current_year.this_week.03_Wednesday", "orderByTime": "ASC", "policy": "default", "refId": "C", "resultFormat": "time_series", "select": [ [ { "params": [ "value" ], "type": "field" }, { "params": [], "type": "mean" } ] ], "tags": [] }, { "alias": "Do", "groupBy": [ { "params": [ "$__interval" ], "type": "time" }, { "params": [ "null" ], "type": "fill" } ], "measurement": "sourceanalytix.0.fronius__0__inverter__1__PAC.consumption.current_year.this_week.04_Thursday", "orderByTime": "ASC", "policy": "default", "refId": "D", "resultFormat": "time_series", "select": [ [ { "params": [ "value" ], "type": "field" }, { "params": [], "type": "mean" } ] ], "tags": [] }, { "alias": "Fr", "groupBy": [ { "params": [ "$__interval" ], "type": "time" }, { "params": [ "null" ], "type": "fill" } ], "measurement": "sourceanalytix.0.fronius__0__inverter__1__PAC.consumption.current_year.this_week.05_Friday", "orderByTime": "ASC", "policy": "default", "refId": "E", "resultFormat": "time_series", "select": [ [ { "params": [ "value" ], "type": "field" }, { "params": [], "type": "mean" } ] ], "tags": [] }, { "alias": "Sa", "groupBy": [ { "params": [ "$__interval" ], "type": "time" }, { "params": [ "null" ], "type": "fill" } ], "measurement": "sourceanalytix.0.fronius__0__inverter__1__PAC.consumption.current_year.this_week.06_Saturday", "orderByTime": "ASC", "policy": "default", "refId": "F", "resultFormat": "time_series", "select": [ [ { "params": [ "value" ], "type": "field" }, { "params": [], "type": "mean" } ] ], "tags": [] }, { "alias": "So", "groupBy": [ { "params": [ "$__interval" ], "type": "time" }, { "params": [ "null" ], "type": "fill" } ], "measurement": "sourceanalytix.0.fronius__0__inverter__1__PAC.consumption.current_year.this_week.07_Sunday", "orderByTime": "ASC", "policy": "default", "refId": "G", "resultFormat": "time_series", "select": [ [ { "params": [ "value" ], "type": "field" }, { "params": [], "type": "mean" } ] ], "tags": [] } ], "thresholds": [], "timeFrom": "7d", "timeRegions": [], "timeShift": null, "title": "Photovoltaik Tageserzeugung", "tooltip": { "shared": false, "sort": 0, "value_type": "individual" }, "transparent": true, "type": "graph", "xaxis": { "buckets": null, "mode": "series", "name": null, "show": true, "values": [ "max" ] }, "yaxes": [ { "format": "kwatth", "label": null, "logBase": 1, "max": null, "min": null, "show": true }, { "format": "short", "label": null, "logBase": 1, "max": null, "min": null, "show": false } ], "yaxis": { "align": false, "alignLevel": null } }, { "aliasColors": { "Erzeugung": "rgb(63, 255, 0)" }, "bars": false, "dashLength": 10, "dashes": false, "datasource": null, "fill": 1, "fillGradient": 5, "gridPos": { "h": 7, "w": 7, "x": 7, "y": 7 }, "hiddenSeries": false, "hideTimeOverride": true, "id": 26, "legend": { "avg": false, "current": true, "max": true, "min": false, "show": true, "total": false, "values": true }, "lines": true, "linewidth": 1, "nullPointMode": "connected", "options": { "dataLinks": [] }, "percentage": false, "pointradius": 2, "points": false, "renderer": "flot", "seriesOverrides": [], "spaceLength": 10, "stack": false, "steppedLine": false, "targets": [ { "alias": "Erzeugung", "groupBy": [ { "params": [ "$__interval" ], "type": "time" }, { "params": [ "0" ], "type": "fill" } ], "measurement": "fronius.0.inverter.1.PAC", "orderByTime": "ASC", "policy": "default", "refId": "A", "resultFormat": "time_series", "select": [ [ { "params": [ "value" ], "type": "field" }, { "params": [], "type": "mean" } ] ], "tags": [] } ], "thresholds": [], "timeFrom": "24h", "timeRegions": [], "timeShift": null, "title": "Photovoltaik Erzeugung 24 Stunden", "tooltip": { "shared": true, "sort": 0, "value_type": "individual" }, "transparent": true, "type": "graph", "xaxis": { "buckets": null, "mode": "time", "name": null, "show": true, "values": [] }, "yaxes": [ { "format": "watth", "label": null, "logBase": 1, "max": null, "min": null, "show": true }, { "format": "short", "label": null, "logBase": 1, "max": null, "min": null, "show": false } ], "yaxis": { "align": false, "alignLevel": null } }, { "aliasColors": { "AKTUELLER_VERBRAUCH.mean": "dark-red", "Aktuelle Erzeugung": "rgb(0, 114, 255)", "Aktuelle Lieferung": "rgb(26, 255, 0)", "Aktueller Verbrauch": "rgb(255, 0, 27)" }, "bars": false, "dashLength": 10, "dashes": false, "datasource": null, "decimals": 2, "fill": 5, "fillGradient": 0, "gridPos": { "h": 7, "w": 7, "x": 14, "y": 7 }, "hiddenSeries": false, "hideTimeOverride": true, "id": 2, "legend": { "alignAsTable": false, "avg": false, "current": true, "hideEmpty": false, "hideZero": false, "max": true, "min": false, "rightSide": false, "show": true, "total": false, "values": true }, "lines": true, "linewidth": 1, "nullPointMode": "connected", "options": { "dataLinks": [] }, "percentage": false, "pointradius": 2, "points": false, "renderer": "flot", "seriesOverrides": [], "spaceLength": 10, "stack": false, "steppedLine": false, "targets": [ { "alias": "Aktuelle Lieferung", "groupBy": [ { "params": [ "$__interval" ], "type": "time" }, { "params": [ "previous" ], "type": "fill" } ], "measurement": "AKTUELLE_LIEFERUNG", "orderByTime": "ASC", "policy": "default", "refId": "A", "resultFormat": "time_series", "select": [ [ { "params": [ "value" ], "type": "field" }, { "params": [], "type": "last" } ] ], "tags": [] }, { "alias": "Aktueller Verbrauch", "groupBy": [ { "params": [ "$__interval" ], "type": "time" }, { "params": [ "previous" ], "type": "fill" } ], "measurement": "AKTUELLER_VERBRAUCH", "orderByTime": "ASC", "policy": "default", "refId": "B", "resultFormat": "time_series", "select": [ [ { "params": [ "value" ], "type": "field" }, { "params": [], "type": "last" } ] ], "tags": [] }, { "alias": "Aktuelle Erzeugung", "groupBy": [ { "params": [ "$__interval" ], "type": "time" }, { "params": [ "previous" ], "type": "fill" } ], "measurement": "fronius.0.inverter.1.PAC", "orderByTime": "ASC", "policy": "default", "refId": "C", "resultFormat": "time_series", "select": [ [ { "params": [ "value" ], "type": "field" }, { "params": [], "type": "last" } ] ], "tags": [] } ], "thresholds": [], "timeFrom": "24h", "timeRegions": [], "timeShift": null, "title": "Strom Verbrauch/Lieferung/Erzeugung 24 Stunden", "tooltip": { "shared": true, "sort": 0, "value_type": "individual" }, "transparent": true, "type": "graph", "xaxis": { "buckets": null, "mode": "time", "name": null, "show": true, "values": [] }, "yaxes": [ { "decimals": null, "format": "watth", "label": null, "logBase": 1, "max": null, "min": "0", "show": true }, { "decimals": null, "format": "watt", "label": null, "logBase": 1, "max": null, "min": "0", "show": false } ], "yaxis": { "align": false, "alignLevel": 0 } }, { "aliasColors": { "Verbrauch": "rgb(29, 255, 0)" }, "bars": false, "dashLength": 10, "dashes": false, "datasource": null, "fill": 5, "fillGradient": 10, "gridPos": { "h": 7, "w": 7, "x": 0, "y": 14 }, "hiddenSeries": false, "hideTimeOverride": true, "id": 22, "legend": { "alignAsTable": false, "avg": false, "current": true, "max": false, "min": false, "show": true, "total": false, "values": true }, "lines": true, "linewidth": 1, "nullPointMode": "connected", "options": { "dataLinks": [] }, "percentage": false, "pointradius": 2, "points": false, "renderer": "flot", "seriesOverrides": [], "spaceLength": 10, "stack": false, "steppedLine": false, "targets": [ { "alias": "Verbrauch", "groupBy": [ { "params": [ "$__interval" ], "type": "time" }, { "params": [ "null" ], "type": "fill" } ], "measurement": "Serverschrank_aktuell", "orderByTime": "ASC", "policy": "default", "refId": "A", "resultFormat": "time_series", "select": [ [ { "params": [ "value" ], "type": "field" }, { "params": [], "type": "mean" } ] ], "tags": [] } ], "thresholds": [], "timeFrom": "now/d", "timeRegions": [], "timeShift": null, "title": "Serverschrank aktuell", "tooltip": { "shared": true, "sort": 0, "value_type": "individual" }, "transparent": true, "type": "graph", "xaxis": { "buckets": null, "mode": "time", "name": null, "show": true, "values": [] }, "yaxes": [ { "format": "watt", "label": "", "logBase": 1, "max": null, "min": null, "show": true }, { "format": "short", "label": null, "logBase": 1, "max": null, "min": null, "show": false } ], "yaxis": { "align": false, "alignLevel": null } }, { "aliasColors": { "Aquarium_aktuell.mean": "rgb(60, 255, 0)", "Verbrauch": "rgb(59, 255, 0)" }, "bars": false, "dashLength": 10, "dashes": false, "datasource": null, "fill": 5, "fillGradient": 10, "gridPos": { "h": 7, "w": 7, "x": 7, "y": 14 }, "hiddenSeries": false, "hideTimeOverride": true, "id": 18, "interval": "", "legend": { "alignAsTable": false, "avg": false, "current": true, "hideEmpty": false, "hideZero": false, "max": true, "min": true, "show": true, "total": false, "values": true }, "lines": true, "linewidth": 1, "nullPointMode": "connected", "options": { "dataLinks": [] }, "percentage": false, "pointradius": 2, "points": false, "renderer": "flot", "repeat": null, "seriesOverrides": [], "spaceLength": 10, "stack": false, "steppedLine": false, "targets": [ { "alias": "Verbrauch", "groupBy": [ { "params": [ "$__interval" ], "type": "time" }, { "params": [ "null" ], "type": "fill" } ], "measurement": "Aquarium_aktuell", "orderByTime": "ASC", "policy": "default", "refId": "A", "resultFormat": "time_series", "select": [ [ { "params": [ "value" ], "type": "field" }, { "params": [], "type": "mean" } ] ], "tags": [] } ], "thresholds": [], "timeFrom": "now/d", "timeRegions": [], "timeShift": null, "title": "Aquarium aktuell", "tooltip": { "shared": true, "sort": 0, "value_type": "individual" }, "transparent": true, "type": "graph", "xaxis": { "buckets": null, "mode": "time", "name": null, "show": true, "values": [] }, "yaxes": [ { "decimals": null, "format": "watt", "label": "", "logBase": 1, "max": null, "min": null, "show": true }, { "format": "short", "label": null, "logBase": 1, "max": null, "min": null, "show": false } ], "yaxis": { "align": false, "alignLevel": null } }, { "aliasColors": { "aktuell": "rgb(29, 255, 0)" }, "bars": false, "dashLength": 10, "dashes": false, "datasource": null, "fill": 5, "fillGradient": 10, "gridPos": { "h": 7, "w": 7, "x": 14, "y": 14 }, "hiddenSeries": false, "hideTimeOverride": true, "id": 14, "legend": { "alignAsTable": false, "avg": false, "current": true, "hideEmpty": false, "hideZero": false, "max": true, "min": true, "show": true, "total": false, "values": true }, "lines": true, "linewidth": 1, "nullPointMode": "connected", "options": { "dataLinks": [] }, "percentage": false, "pointradius": 2, "points": false, "renderer": "flot", "seriesOverrides": [], "spaceLength": 10, "stack": false, "steppedLine": false, "targets": [ { "alias": "aktuell", "groupBy": [ { "params": [ "$__interval" ], "type": "time" }, { "params": [ "null" ], "type": "fill" } ], "measurement": "PC_aktuell", "orderByTime": "ASC", "policy": "default", "refId": "A", "resultFormat": "time_series", "select": [ [ { "params": [ "value" ], "type": "field" }, { "params": [], "type": "mean" } ] ], "tags": [] } ], "thresholds": [], "timeFrom": "now/d", "timeRegions": [], "timeShift": null, "title": "PC aktuell", "tooltip": { "shared": true, "sort": 0, "value_type": "individual" }, "transparent": true, "type": "graph", "xaxis": { "buckets": null, "mode": "time", "name": null, "show": true, "values": [] }, "yaxes": [ { "format": "watt", "label": null, "logBase": 1, "max": null, "min": null, "show": true }, { "format": "short", "label": null, "logBase": 1, "max": null, "min": null, "show": false } ], "yaxis": { "align": false, "alignLevel": null } }, { "aliasColors": { "Aussentemperatur": "rgb(0, 100, 255)", "Temperatur_aussen_aktuell.mean": "rgb(23, 0, 255)" }, "bars": false, "dashLength": 10, "dashes": false, "datasource": null, "decimals": 2, "description": "", "fill": 5, "fillGradient": 10, "gridPos": { "h": 7, "w": 7, "x": 0, "y": 21 }, "hiddenSeries": false, "hideTimeOverride": true, "id": 12, "legend": { "alignAsTable": false, "avg": false, "current": true, "max": true, "min": true, "show": true, "total": false, "values": true }, "lines": true, "linewidth": 1, "nullPointMode": "connected", "options": { "dataLinks": [] }, "percentage": false, "pointradius": 2, "points": false, "renderer": "flot", "seriesOverrides": [], "spaceLength": 10, "stack": false, "steppedLine": false, "targets": [ { "alias": "Aussentemperatur", "groupBy": [ { "params": [ "$__interval" ], "type": "time" }, { "params": [ "null" ], "type": "fill" } ], "measurement": "Aussentemp-Keller", "orderByTime": "ASC", "policy": "default", "refId": "A", "resultFormat": "time_series", "select": [ [ { "params": [ "value" ], "type": "field" }, { "params": [], "type": "mean" } ] ], "tags": [] } ], "thresholds": [], "timeFrom": "24h", "timeRegions": [], "timeShift": null, "title": "Aussentemperatur", "tooltip": { "shared": true, "sort": 0, "value_type": "individual" }, "transparent": true, "type": "graph", "xaxis": { "buckets": null, "mode": "time", "name": null, "show": true, "values": [] }, "yaxes": [ { "decimals": null, "format": "celsius", "label": null, "logBase": 1, "max": null, "min": null, "show": true }, { "format": "short", "label": null, "logBase": 1, "max": null, "min": null, "show": false } ], "yaxis": { "align": false, "alignLevel": null } }, { "aliasColors": { "Bad": "rgb(64, 255, 0)", "Kinderzimmer": "rgb(255, 0, 4)", "Temperatur_Bad.mean": "rgb(65, 255, 0)", "Temperatur_KiZi.mean": "rgb(255, 183, 0)", "Temperatur_WoZi.mean": "rgb(0, 218, 255)", "Wohnzimmer": "rgb(0, 218, 255)" }, "bars": false, "dashLength": 10, "dashes": false, "datasource": null, "decimals": 2, "fill": 5, "fillGradient": 10, "gridPos": { "h": 7, "w": 7, "x": 7, "y": 21 }, "hiddenSeries": false, "hideTimeOverride": true, "id": 10, "legend": { "alignAsTable": false, "avg": false, "current": false, "hideEmpty": false, "hideZero": false, "max": false, "min": false, "show": true, "total": false, "values": false }, "lines": true, "linewidth": 1, "nullPointMode": "connected", "options": { "dataLinks": [] }, "percentage": false, "pointradius": 2, "points": false, "renderer": "flot", "seriesOverrides": [], "spaceLength": 10, "stack": false, "steppedLine": false, "targets": [ { "alias": "Bad", "groupBy": [ { "params": [ "$__interval" ], "type": "time" }, { "params": [ "null" ], "type": "fill" } ], "measurement": "Temperatur_Bad", "orderByTime": "ASC", "policy": "default", "refId": "A", "resultFormat": "time_series", "select": [ [ { "params": [ "value" ], "type": "field" }, { "params": [], "type": "mean" } ] ], "tags": [] }, { "alias": "Kinderzimmer", "groupBy": [ { "params": [ "$__interval" ], "type": "time" }, { "params": [ "null" ], "type": "fill" } ], "measurement": "Temperatur_KiZi", "orderByTime": "ASC", "policy": "default", "refId": "B", "resultFormat": "time_series", "select": [ [ { "params": [ "value" ], "type": "field" }, { "params": [], "type": "mean" } ] ], "tags": [] }, { "alias": "Wohnzimmer", "groupBy": [ { "params": [ "$__interval" ], "type": "time" }, { "params": [ "null" ], "type": "fill" } ], "measurement": "Temperatur_WoZi", "orderByTime": "ASC", "policy": "default", "refId": "C", "resultFormat": "time_series", "select": [ [ { "params": [ "value" ], "type": "field" }, { "params": [], "type": "mean" } ] ], "tags": [] } ], "thresholds": [], "timeFrom": "24h", "timeRegions": [], "timeShift": null, "title": "Zimmertemperatur", "tooltip": { "shared": true, "sort": 0, "value_type": "individual" }, "transparent": true, "type": "graph", "xaxis": { "buckets": null, "mode": "time", "name": null, "show": true, "values": [] }, "yaxes": [ { "decimals": 2, "format": "celsius", "label": null, "logBase": 1, "max": null, "min": null, "show": true }, { "format": "short", "label": null, "logBase": 1, "max": null, "min": null, "show": false } ], "yaxis": { "align": true, "alignLevel": 0 } }, { "aliasColors": { "Download": "rgb(63, 255, 0)", "Upload": "rgb(255, 0, 23)", "Webspeedy Download.mean": "rgb(58, 255, 0)" }, "bars": false, "dashLength": 10, "dashes": false, "datasource": null, "fill": 5, "fillGradient": 0, "gridPos": { "h": 7, "w": 7, "x": 14, "y": 21 }, "hiddenSeries": false, "id": 6, "legend": { "alignAsTable": false, "avg": false, "current": false, "max": true, "min": true, "show": true, "total": false, "values": true }, "lines": true, "linewidth": 1, "nullPointMode": "connected", "options": { "dataLinks": [] }, "percentage": false, "pointradius": 2, "points": false, "renderer": "flot", "seriesOverrides": [], "spaceLength": 10, "stack": false, "steppedLine": false, "targets": [ { "alias": "Download", "groupBy": [ { "params": [ "$__interval" ], "type": "time" }, { "params": [ "null" ], "type": "fill" } ], "measurement": "Webspeedy Download", "orderByTime": "ASC", "policy": "default", "refId": "A", "resultFormat": "time_series", "select": [ [ { "params": [ "value" ], "type": "field" }, { "params": [], "type": "last" } ] ], "tags": [] }, { "alias": "Upload", "groupBy": [ { "params": [ "$__interval" ], "type": "time" }, { "params": [ "null" ], "type": "fill" } ], "measurement": "Webspeedy Upload", "orderByTime": "ASC", "policy": "default", "refId": "B", "resultFormat": "time_series", "select": [ [ { "params": [ "value" ], "type": "field" }, { "params": [], "type": "last" } ] ], "tags": [] } ], "thresholds": [], "timeFrom": "24h", "timeRegions": [], "timeShift": null, "title": "Speedtest", "tooltip": { "shared": true, "sort": 0, "value_type": "individual" }, "transparent": true, "type": "graph", "xaxis": { "buckets": null, "mode": "time", "name": null, "show": true, "values": [] }, "yaxes": [ { "decimals": 2, "format": "Mbits", "label": "", "logBase": 1, "max": null, "min": "0", "show": true }, { "format": "short", "label": null, "logBase": 1, "max": null, "min": null, "show": false } ], "yaxis": { "align": true, "alignLevel": 0 } } ], "refresh": "1m", "schemaVersion": 22, "style": "dark", "tags": [], "templating": { "list": [] }, "time": { "from": "now-24h", "to": "now" }, "timepicker": { "refresh_intervals": [ "5s", "10s", "30s", "1m", "5m", "15m", "30m", "1h", "2h", "1d" ] }, "timezone": "", "title": "Allgemein", "uid": "XMW0dj_Wz", "version": 119 } -
@Negalein Dankeschön, super, hat funktioniert!
Du verwendest den Sourceanalytix Adapter dazu, der legt die Tage an, so gehts.. ich verwende immer noch das olle Javascript mit der Verbrauchsmessung ( das erste, was damals so umherging..)
