[Linux Shell-Skript] WLAN-Wetterstation
-
@SBorg Dankeschön. Hab den Wert nun händisch angepasst.
-
Neue Version des Wetterstation-Statistik-Addons auf GitHub V0.1.8
- +max. Windböe für Gestern und Jahres-/Rekordwerte
Wie immer zu finden im GitHub (wetterstation-statistik.js)
-
-
@sonystar sagte in [Linux Shell-Skript] WLAN-Wetterstation:
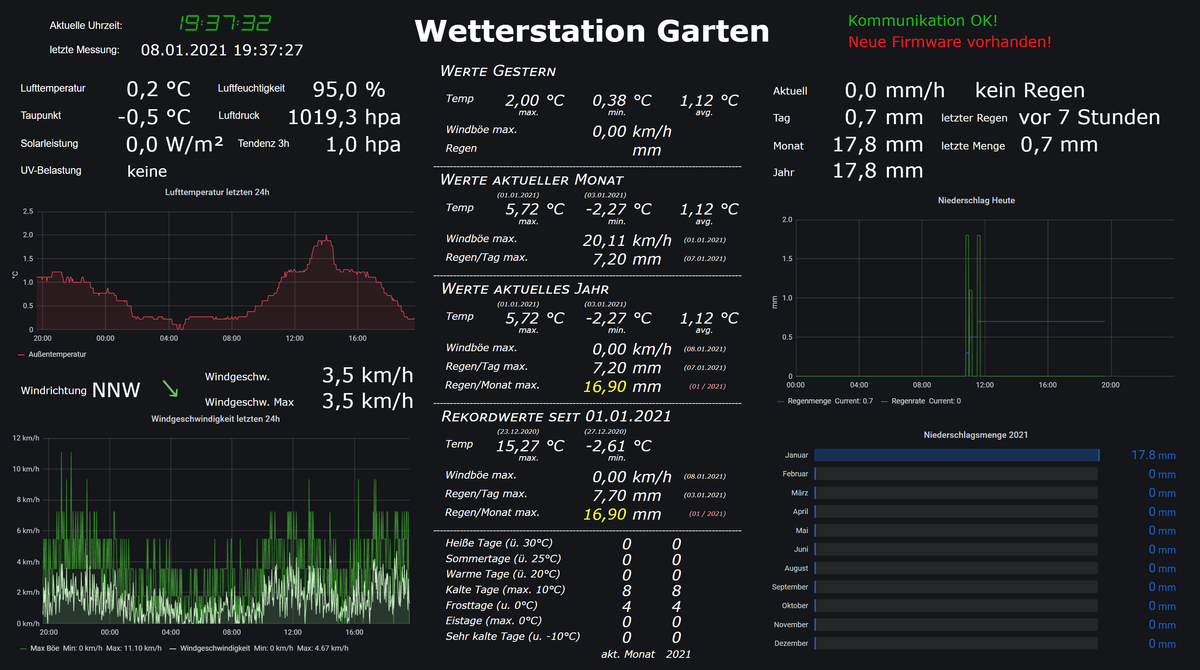
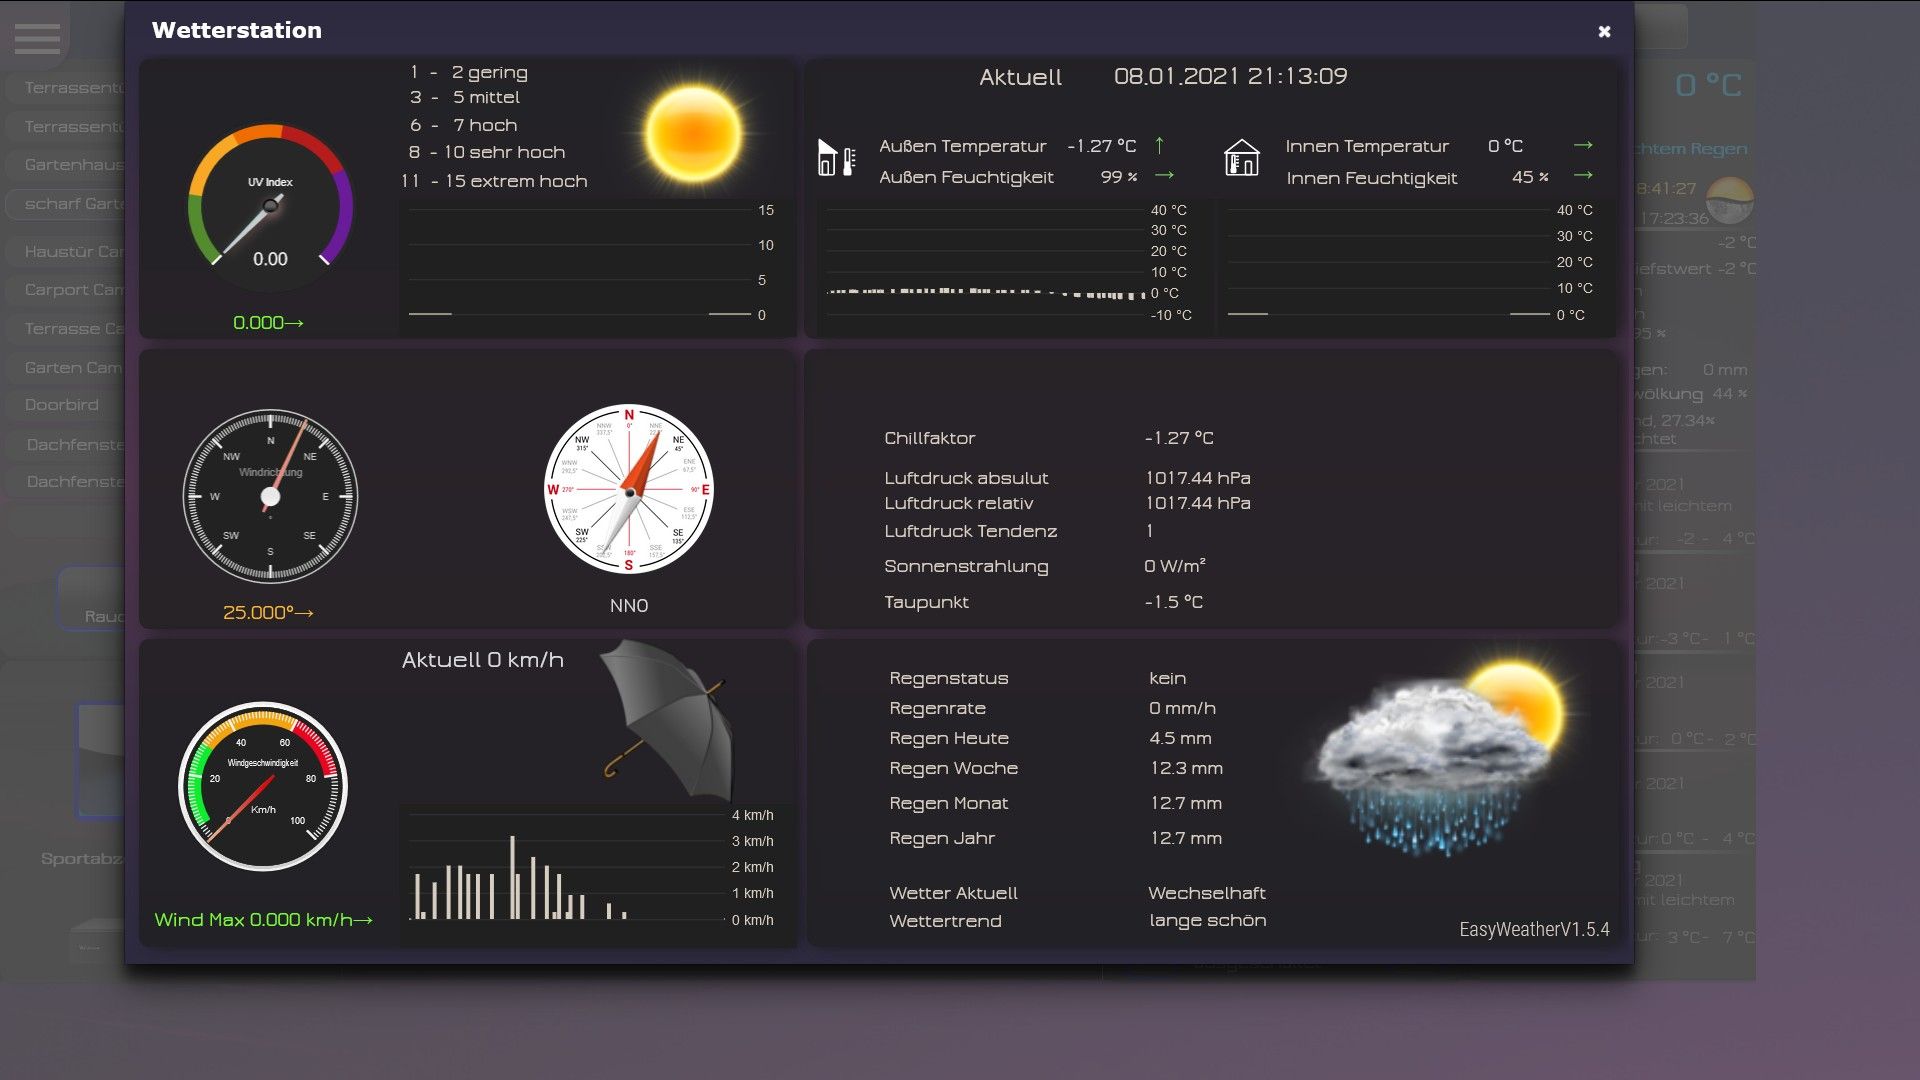
Langsam nimmt meine Visu auch Formen an
schaut gut aus!
Würdest du den mittleren und rechten unteren Teil als Json exportieren?
Oder falls einzeln nicht geht, das ganze Dashboard.Würde gern Teile davon übernehmen.
-
Danke!
Wenn du mir sagst wie das geht mach ich das gerne.
Rechts unten sind allerdings Datenpunkte aus dem Sourceanalytix-Adapter. -
@sonystar sagte in [Linux Shell-Skript] WLAN-Wetterstation:
Wenn du mir sagst wie das geht mach ich das gerne.
Danke
Rechts unten sind allerdings Datenpunkte aus dem Sourceanalytix-Adapter.
kein Problem. Damit logge ich auch.
-
@Negalein
Hier (hoffentlich) das JSON für das Diagramm unten rechts.
Die Visu ist allerdings in VIS aufgebaut, nur die Diagramme kommen aus Grafana.
-
@sonystar sagte in [Linux Shell-Skript] WLAN-Wetterstation:
Hier (hoffentlich) das JSON für das Diagramm unten rechts.
Danke, hat geklappt!
")
Schaffst du den mittleren Teil auch noch? -
Wie gesagt, die Visu ist in VIS, nur die Diagramme kommen aus Grafana.
Kann dir gerne den View exportieren wenn du das möchtest? -
@sonystar sagte in [Linux Shell-Skript] WLAN-Wetterstation:
Wie gesagt, die Visu ist in VIS, nur die Diagramme kommen aus Grafana.
Ah, jetzt versteh ich!
Kann dir gerne den View exportieren wenn du das möchtest?
Ja bitte
-
Hier der View aus VIS
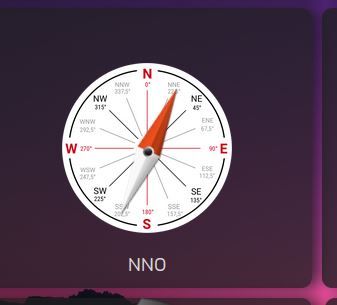
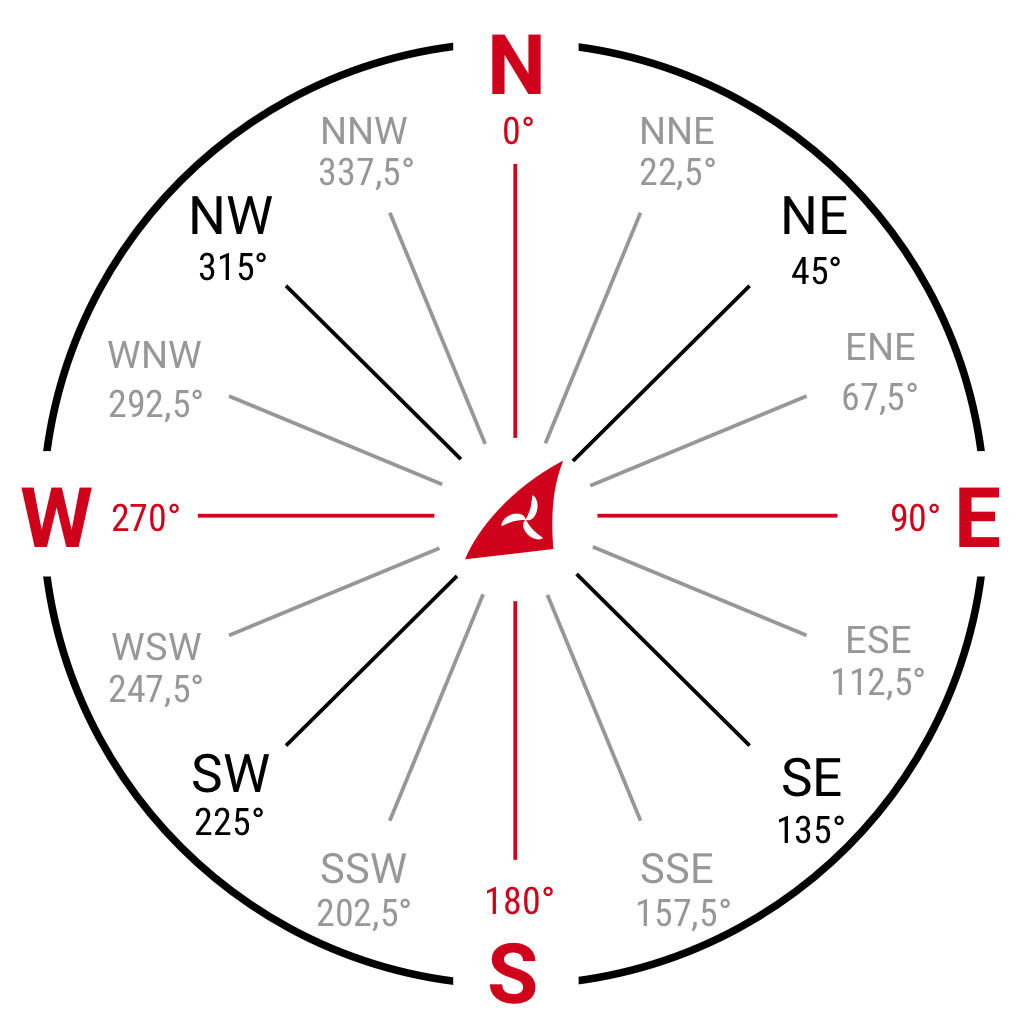
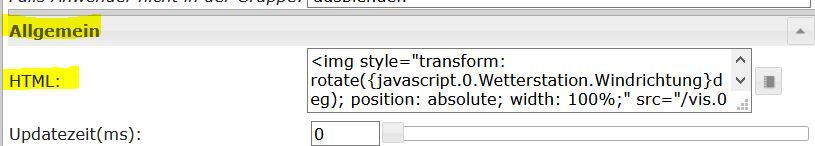
Mir gefällt die Windrose noch nicht, da hätte ich gerne so etwas wie @Glasfaser z.B., aber in Vis. Bin da noch nicht so richtig dahintergestiegen.
-
-
@Glasfaser Wenn du so freundlich wärst? Kommt das aus VIS oder Grafana?
-
Ist aus VIS
-
Dann bitte ja

-
-
Habe es als ganzes Exportiert !
-
Dankeschön hat funktioniert!
-
@Glasfaser sagte in [Linux Shell-Skript] WLAN-Wetterstation:
@SBorg Bitte in deinem Startbeitrag verlinken
Danke und done...

-
Neue Version des Wetterstation-Statistik-Addons auf GitHub V0.1.9
- +Regenmenge eines kpl. Monats im Jahr und Rekord
Wie immer zu finden im GitHub (wetterstation-statistik.js)
Dabei wird der Jahreswert nur zum 01. des Monats aktualisiert (sollte also am 01.02. auf jeden Fall eine Menge stehen, denn aktuell ist es ja "Null"; dann halt nur noch wenn im entsprechenden Monat mehr Regen fiel als bei allen bisherigen Monaten diesen Jahres).
Abweichend davon wird der Rekordwert aber täglich geschrieben. Sollte sich also ggf. bis 31.01. zu einem Monatsrekordwert aufsummieren, dann nur noch wenn auch tatsächlich ein neuer Rekordwert erreicht wurde.Beispiel: 5mm Regen an drei Tagen im Monat
Jahreswert zeigt am folgenden 01. 15mm/m² an
Rekord zeigt am 1. Tag 5mm, am 2. Tag 10mm, am 3. Tag 15mm an und verbleibt dann bei 15mm im Monat xyznächster Monat kein Regen:
Jahreswert dann am 01. weiterhin 15mm (war ja kein neuer Rekord für dieses Jahr)
Rekord (er summiert zwar munter weiter, aber 0 + 0 + 0 + ....+0 = immer noch 0), ebenfalls weiterhin bei 15mmMonat(e) mit weniger als den 15mm : es bleibt wie es ist...
Monsun-Monat: 5 Tage a 10mm
Jahreswert zeigt dann am folgenden 01. 50mm an (war ja ein neuer Rekord für dieses Jahr)
Rekord zeigt dann am 1. Tag weiterhin die bisherigen 15mm (ist ja noch kein neuer Rekord), am 2. Tag jetzt aber 20mm (da neuer Rekord), am 3. Tag 30mm (da wieder neuer Rekord), am 4. Tag 40mm (da schon wieder neuer Rekord) und am 5. Tag 50mm (da abermals neuer Rekord) an und verbleibt dann bei 50mm im Monat xyz bis er (oder auch nie mehr) gebrochen wird. Am Monatsersten wird dann der interne Wert wieder genullt und neu addiert.Verwirrt? Keine Ahnung wie man das "einfach" schreibt...