Test Adapter History 2.0.0
-
@homoran COngrats, you forund a bug :-)) Fixed ion GitHub
-
@apollon77 Aber immer wieder gerne

EDIT:
Works like a charm!
Endlich kann ich meine Charts aufräumen.
Sind natürlich jetzt unendlich viele DPs mit Dp*8 null drin
-
@homoran Viel Erfolg
-
@apollon77 sagte in Test Adapter History 2.0.0:
@homoran COngrats, you forund a bug :-)) Fixed ion GitHub
ich versuche es gleich nochmal
")
Ich habe gerade festgestellt, dass in einem Chart eine Linie fehlte.
Beim Versuch die Daten des zuständigen Datenpunktes anzusehen scheint history abgestürzt zu sein:2022-04-28 14:41:30.041 - error: host.iobroker-VM03 Caught by controller[0]: <--- Last few GCs ---> 2022-04-28 14:41:30.043 - error: host.iobroker-VM03 Caught by controller[0]: [2034430:0x597ac00] 38402 ms: Mark-sweep 1862.1 (1987.9) -> 1858.1 (1990.6) MB, 1777.6 / 0.0 ms (average mu = 0.225, current mu = 0.029) allocation failure scavenge might not succeed 2022-04-28 14:41:30.043 - error: host.iobroker-VM03 Caught by controller[0]: [2034430:0x597ac00] 40186 ms: Mark-sweep 1874.1 (1990.6) -> 1870.1 (1993.1) MB, 1712.1 / 0.0 ms (average mu = 0.147, current mu = 0.040) allocation failure scavenge might not succeed 2022-04-28 14:41:30.043 - error: host.iobroker-VM03 Caught by controller[0]: <--- JS stacktrace ---> 2022-04-28 14:41:30.043 - error: host.iobroker-VM03 Caught by controller[0]: FATAL ERROR: Ineffective mark-compacts near heap limit Allocation failed - JavaScript heap out of memory 2022-04-28 14:41:30.043 - error: host.iobroker-VM03 Caught by controller[1]: 1: 0xa3aaf0 node::Abort() [io.history.0] 2022-04-28 14:41:30.043 - error: host.iobroker-VM03 Caught by controller[2]: 2: 0x970199 node::FatalError(char const*, char const*) [io.history.0] 2022-04-28 14:41:30.044 - error: host.iobroker-VM03 Caught by controller[3]: 3: 0xbba45e v8::Utils::ReportOOMFailure(v8::internal::Isolate*, char const*, bool) [io.history.0] 2022-04-28 14:41:30.044 - error: host.iobroker-VM03 Caught by controller[4]: 4: 0xbba7d7 v8::internal::V8::FatalProcessOutOfMemory(v8::internal::Isolate*, char const*, bool) [io.history.0] 2022-04-28 14:41:30.044 - error: host.iobroker-VM03 Caught by controller[5]: 5: 0xd769e5 [io.history.0] 2022-04-28 14:41:30.044 - error: host.iobroker-VM03 Caught by controller[6]: 6: 0xd7756f [io.history.0] 2022-04-28 14:41:30.044 - error: host.iobroker-VM03 Caught by controller[7]: 7: 0xd853ab v8::internal::Heap::CollectGarbage(v8::internal::AllocationSpace, v8::internal::GarbageCollectionReason, v8::GCCallbackFlags) [io.history.0] 2022-04-28 14:41:30.044 - error: host.iobroker-VM03 Caught by controller[8]: 8: 0xd88f6c v8::internal::Heap::AllocateRawWithRetryOrFailSlowPath(int, v8::internal::AllocationType, v8::internal::AllocationOrigin, v8::internal::AllocationAlignment) [io.history.0] 2022-04-28 14:41:30.044 - error: host.iobroker-VM03 Caught by controller[9]: 9: 0xd4e73d v8::internal::Factory::AllocateRaw(int, v8::internal::AllocationType, v8::internal::AllocationAlignment) [io.history.0] 2022-04-28 14:41:30.044 - error: host.iobroker-VM03 Caught by controller[10]: 10: 0xd4a999 v8::internal::FactoryBase::AllocateRawArray(int, v8::internal::AllocationType) [io.history.0] 2022-04-28 14:41:30.044 - error: host.iobroker-VM03 Caught by controller[11]: 11: 0xd4aa54 v8::internal::FactoryBase::NewFixedArrayWithFiller(v8::internal::Handle, int, v8::internal::Handle, v8::internal::AllocationType) [io.history.0] 2022-04-28 14:41:30.044 - error: host.iobroker-VM03 Caught by controller[12]: 12: 0xf80ffe v8::internal::Handle v8::internal::HashTable::New(v8::internal::Isolate*, int, v8::internal::AllocationType, v8::internal::MinimumCapacity) [io.history.0] 2022-04-28 14:41:30.044 - error: host.iobroker-VM03 Caught by controller[13]: 13: 0xf81cf9 v8::internal::Handle v8::internal::BaseNameDictionary::New(v8::internal::Isolate*, int, v8::internal::AllocationType, v8::internal::MinimumCapacity) [io.history.0] 2022-04-28 14:41:30.044 - error: host.iobroker-VM03 Caught by controller[14]: 14: 0xf35be1 v8::internal::JSObject::MigrateToMap(v8::internal::Isolate*, v8::internal::Handle, v8::internal::Handle, int) [io.history.0] 2022-04-28 14:41:30.044 - error: host.iobroker-VM03 Caught by controller[15]: 15: 0xf556cc v8::internal::LookupIterator::Delete() [io.history.0] 2022-04-28 14:41:30.044 - error: host.iobroker-VM03 Caught by controller[16]: 16: 0xf2c55b v8::internal::JSReceiver::DeleteProperty(v8::internal::LookupIterator*, v8::internal::LanguageMode) [io.history.0] 2022-04-28 14:41:30.044 - error: host.iobroker-VM03 Caught by controller[17]: 17: 0x10b4600 v8::internal::Runtime::DeleteObjectProperty(v8::internal::Isolate*, v8::internal::Handle, v8::internal::Handle, v8::internal::LanguageMode) [io.history.0] 2022-04-28 14:41:30.045 - error: host.iobroker-VM03 Caught by controller[18]: 18: 0x10b673a v8::internal::Runtime_DeleteProperty(int, unsigned long*, v8::internal::Isolate*) [io.history.0] 2022-04-28 14:41:30.045 - error: host.iobroker-VM03 Caught by controller[19]: 19: 0x1448e19 [io.history.0] 2022-04-28 14:41:30.045 - warn: host.iobroker-VM03 instance system.adapter.history.0 terminated due to SIGABRTEDIT:
Habe bei dem Datenpunkt Logging deaktiviert und neu konfiguriert.
Seitdem loggt er anscheinend wieder, aber sobald ich mir die Werte ansehen will stürzt history ab -
@homoran Wie lange zurück schaust Du denn? Das ist ein "Out of memory" ... Ansonsten Debug wieder an und dann mal log von so einem crash senden
-
@apollon77 sagte in Test Adapter History 2.0.0:
Das ist ein "Out of memory"
Hatte ich gesehen
habe 4GB RAM zugewiesen und etwa 0,5GB free und 1,5 - 2 GB available@apollon77 sagte in Test Adapter History 2.0.0:
Wie lange zurück schaust Du denn?
erst drei Tage, dann nur noch 10 Minuten.
Allerdings loggt er (???) alle 6 Sekundenscheint in Zeile 119 loszugehen
-
@homoran siehst du wieviele getHistpry abfragen da quasi parallel kommen ?! Wow. Ixh schaue mal.
-
@homoran Ich hab mal versucht was zu optimieren, aber das ist schwierig. versuch mal GitHub version. Sonst setzen wir einfach den Heap für deinen Prozess hoch
-
Auf GitHub sind einige Fixes hinzugekommen und auch noch zwei neue Features:
- Bei storeState kann nun mittels dem Parameter "rule=true" festlegen das die Daten nicht direkt geloggt werden sondern alle Rules angewendet werden wie für jeden normalen Wert - inkl. Debounce u.ä. Bitte vorsichtig nutzen das nicht unabsichtlich Werte nicht geschrieben werden!
- Eine Einstellung pro Datenpunkt ist dazugekommen, mit der man angeben kann auf wie viele Stellen nach dem Komma die Werte beim lesen (GetHistory) gerundet werden.
-
@apollon77 ich bekomme nicht mal einen sinnvollen debug-log zustande
2022-05-01 14:31:34.235 - info: host.iobroker-VM03 stopInstance system.adapter.history.0 (force=false, process=true)
2022-05-01 14:31:38.374 - error: host.iobroker-VM03 Caught by controller[0]: <--- Last few GCs --->
2022-05-01 14:31:38.374 - error: host.iobroker-VM03 Caught by controller[0]: [4074178:0x543dc00] 60961 ms: Mark-sweep 1870.8 (1993.1) -> 1866.8 (1995.6) MB, 1798.0 / 0.0 ms (average mu = 0.216, current mu = 0.040) allocation failure scavenge might not succeed
2022-05-01 14:31:38.374 - error: host.iobroker-VM03 Caught by controller[0]: [4074178:0x543dc00] 62792 ms: Mark-sweep 1882.7 (1995.6) -> 1878.8 (1998.4) MB, 1761.4 / 0.0 ms (average mu = 0.139, current mu = 0.038) allocation failure scavenge might not succeed
2022-05-01 14:31:38.375 - error: host.iobroker-VM03 Caught by controller[0]: <--- JS stacktrace --->
2022-05-01 14:31:38.375 - error: host.iobroker-VM03 Caught by controller[0]: FATAL ERROR: Ineffective mark-compacts near heap limit Allocation failed - JavaScript heap out of memory
2022-05-01 14:31:38.375 - error: host.iobroker-VM03 Caught by controller[1]: 1: 0xa3aaf0 node::Abort() [io.history.0]
2022-05-01 14:31:38.375 - error: host.iobroker-VM03 Caught by controller[2]: 2: 0x970199 node::FatalError(char const*, char const*) [io.history.0]
2022-05-01 14:31:38.375 - error: host.iobroker-VM03 Caught by controller[3]: 3: 0xbba45e v8::Utils::ReportOOMFailure(v8::internal::Isolate*, char const*, bool) [io.history.0]
2022-05-01 14:31:38.375 - error: host.iobroker-VM03 Caught by controller[4]: 4: 0xbba7d7 v8::internal::V8::FatalProcessOutOfMemory(v8::internal::Isolate*, char const*, bool) [io.history.0]
2022-05-01 14:31:38.375 - error: host.iobroker-VM03 Caught by controller[5]: 5: 0xd769e5 [io.history.0]
2022-05-01 14:31:38.375 - error: host.iobroker-VM03 Caught by controller[6]: 6: 0xd7756f [io.history.0]
2022-05-01 14:31:38.375 - error: host.iobroker-VM03 Caught by controller[7]: 7: 0xd853ab v8::internal::Heap::CollectGarbage(v8::internal::AllocationSpace, v8::internal::GarbageCollectionReason, v8::GCCallbackFlags) [io.history.0]
2022-05-01 14:31:38.375 - error: host.iobroker-VM03 Caught by controller[8]: 8: 0xd88f6c v8::internal::Heap::AllocateRawWithRetryOrFailSlowPath(int, v8::internal::AllocationType, v8::internal::AllocationOrigin, v8::internal::AllocationAlignment) [io.history.0]
2022-05-01 14:31:38.376 - error: host.iobroker-VM03 Caught by controller[9]: 9: 0xd4e73d v8::internal::Factory::AllocateRaw(int, v8::internal::AllocationType, v8::internal::AllocationAlignment) [io.history.0]
2022-05-01 14:31:38.376 - error: host.iobroker-VM03 Caught by controller[10]: 10: 0xd4a999 v8::internal::FactoryBase::AllocateRawArray(int, v8::internal::AllocationType) [io.history.0]
2022-05-01 14:31:38.376 - error: host.iobroker-VM03 Caught by controller[11]: 11: 0xd4aa54 v8::internal::FactoryBase::NewFixedArrayWithFiller(v8::internal::Handle, int, v8::internal::Handle, v8::internal::AllocationType) [io.history.0]
2022-05-01 14:31:38.376 - error: host.iobroker-VM03 Caught by controller[12]: 12: 0xf80ffe v8::internal::Handle v8::internal::HashTable::New(v8::internal::Isolate*, int, v8::internal::AllocationType, v8::internal::MinimumCapacity) [io.history.0]
2022-05-01 14:31:38.376 - error: host.iobroker-VM03 Caught by controller[13]: 13: 0xf81cf9 v8::internal::Handle v8::internal::BaseNameDictionary::New(v8::internal::Isolate*, int, v8::internal::AllocationType, v8::internal::MinimumCapacity) [io.history.0]
2022-05-01 14:31:38.376 - error: host.iobroker-VM03 Caught by controller[14]: 14: 0xf35be1 v8::internal::JSObject::MigrateToMap(v8::internal::Isolate*, v8::internal::Handle, v8::internal::Handle, int) [io.history.0]
2022-05-01 14:31:38.376 - error: host.iobroker-VM03 Caught by controller[15]: 15: 0xf556cc v8::internal::LookupIterator::Delete() [io.history.0]
2022-05-01 14:31:38.376 - error: host.iobroker-VM03 Caught by controller[16]: 16: 0xf2c55b v8::internal::JSReceiver::DeleteProperty(v8::internal::LookupIterator*, v8::internal::LanguageMode) [io.history.0]
2022-05-01 14:31:38.376 - error: host.iobroker-VM03 Caught by controller[17]: 17: 0x10b4600 v8::internal::Runtime::DeleteObjectProperty(v8::internal::Isolate*, v8::internal::Handle, v8::internal::Handle, v8::internal::LanguageMode) [io.history.0]
2022-05-01 14:31:38.376 - error: host.iobroker-VM03 Caught by controller[18]: 18: 0x10b673a v8::internal::Runtime_DeleteProperty(int, unsigned long*, v8::internal::Isolate*) [io.history.0]
2022-05-01 14:31:38.376 - error: host.iobroker-VM03 Caught by controller[19]: 19: 0x1448e19 [io.history.0]
2022-05-01 14:31:38.376 - warn: host.iobroker-VM03 instance system.adapter.history.0 terminated due to SIGABRT
2022-05-01 14:31:38.376 - info: host.iobroker-VM03 instance system.adapter.history.0 terminated with code NaN ()
Habe dann immer relativ schnell den debug wieder abschalten wollen um das log nicht zu groß werden zu lassen, aber anscheinend kommt nach dem Absturz erst wieder dei Meldungen vom Neustart und dann..
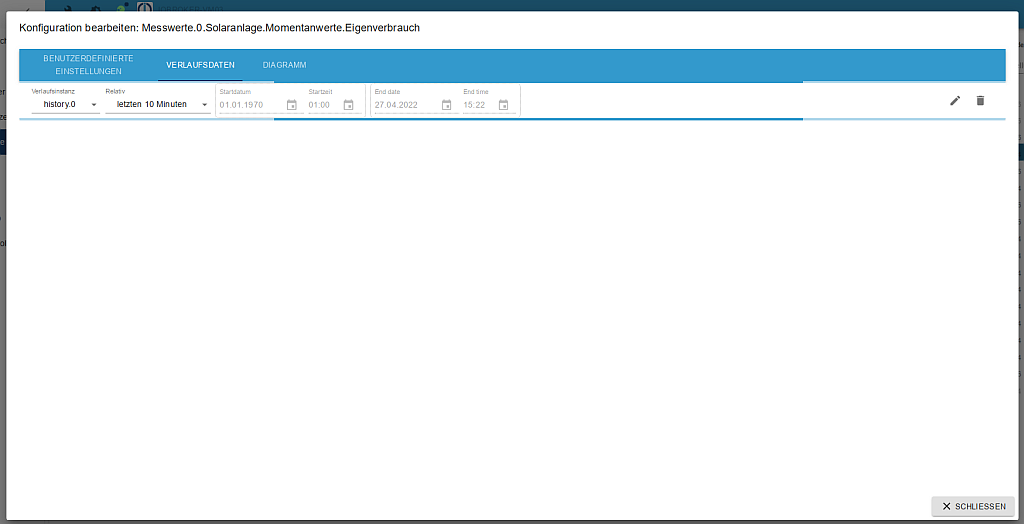
wobei ich da auf die Schnelle nichts finde was zu dem DP gehört, den ich öffnen will:
Messwerte.0.Solaranlage.Momentanwerte.Eigenverbrauchübrigens bei allen DPs, die im 6Sekunden-Takt loggen gleiches Problem.
@apollon77 sagte in Test Adapter History 2.0.0:
Auf GitHub sind einige Fixes hinzugekommen und auch noch zwei neue Features:
aber immer noch 2.0.0??
-
@homoran wo kommen denn diese massiv vielen gehHistory calls her? Das sind ja mehrere pro Sekunde???
Vor allem
Für den gleichen Datenpunkt. Weil am Ende ist’s sehr einfach: jeder der calls lädt mindestens die Daten des gesamten Tages und dann werden die auf die relevante Zeit gekürzt quasi. Ich schaue nochmal ob man das optimieren kannUnd ja. GitHub weiter auf 2.0.0
-
@apollon77 sagte in Test Adapter History 2.0.0:
wo kommen denn diese massiv vielen gehHistory calls her? Das sind ja mehrere pro Sekunde???
Vor allem
Für den gleichen Datenpunkt.Ich denke, das liegt daran, dass ich gerade die History des Datenpunktes aufrufe
(Hoffentlich) -
@homoran dann wäre es aber schon ein Admin Bug das er soooooo oft fragt. Muss ich nochmal genau schauen.
-
-
@homoran Update mal?
-
-
@apollon77 und wieder tausend null
Wie gehabt, erst:
2022-05-01 18:57:30.412 - error: host.iobroker-VM03 Caught by controller[0]: <--- Last few GCs --->
2022-05-01 18:57:30.416 - error: host.iobroker-VM03 Caught by controller[0]: [320902:0x4c95c00] 73098 ms: Mark-sweep 1871.8 (1987.1) -> 1867.8 (1989.6) MB, 1742.9 / 0.0 ms (average mu = 0.153, current mu = 0.042) allocation failure scavenge might not succeed
2022-05-01 18:57:30.416 - error: host.iobroker-VM03 Caught by controller[0]: [320902:0x4c95c00] 74837 ms: Mark-sweep 1883.8 (1989.6) -> 1879.9 (1992.1) MB, 1666.9 / 0.0 ms (average mu = 0.103, current mu = 0.041) allocation failure scavenge might not succeed
2022-05-01 18:57:30.416 - error: host.iobroker-VM03 Caught by controller[1]: <--- JS stacktrace --->
2022-05-01 18:57:30.416 - error: host.iobroker-VM03 Caught by controller[1]: FATAL ERROR: Ineffective mark-compacts near heap limit Allocation failed - JavaScript heap out of memory
2022-05-01 18:57:30.417 - error: host.iobroker-VM03 Caught by controller[2]: 1: 0xa3aaf0 node::Abort() [io.history.0]
2022-05-01 18:57:30.417 - error: host.iobroker-VM03 Caught by controller[2]: 2: 0x970199 node::FatalError(char const*, char const*) [io.history.0]
2022-05-01 18:57:30.417 - error: host.iobroker-VM03 Caught by controller[3]: 3: 0xbba45e v8::Utils::ReportOOMFailure(v8::internal::Isolate*, char const*, bool) [io.history.0]
2022-05-01 18:57:30.417 - error: host.iobroker-VM03 Caught by controller[4]: 4: 0xbba7d7 v8::internal::V8::FatalProcessOutOfMemory(v8::internal::Isolate*, char const*, bool) [io.history.0]
2022-05-01 18:57:30.417 - error: host.iobroker-VM03 Caught by controller[4]: 5: 0xd769e5 [io.history.0]
2022-05-01 18:57:30.417 - error: host.iobroker-VM03 Caught by controller[4]: 6: 0xd7756f [io.history.0]
2022-05-01 18:57:30.417 - error: host.iobroker-VM03 Caught by controller[4]: 7: 0xd853ab v8::internal::Heap::CollectGarbage(v8::internal::AllocationSpace, v8::internal::GarbageCollectionReason, v8::GCCallbackFlags) [io.history.0]
2022-05-01 18:57:30.417 - error: host.iobroker-VM03 Caught by controller[4]: 8: 0xd88f6c v8::internal::Heap::AllocateRawWithRetryOrFailSlowPath(int, v8::internal::AllocationType, v8::internal::AllocationOrigin, v8::internal::AllocationAlignment) [io.history.0]
2022-05-01 18:57:30.417 - error: host.iobroker-VM03 Caught by controller[5]: 9: 0xd4e73d v8::internal::Factory::AllocateRaw(int, v8::internal::AllocationType, v8::internal::AllocationAlignment) [io.history.0]
2022-05-01 18:57:30.417 - error: host.iobroker-VM03 Caught by controller[6]: 10: 0xd4a999 v8::internal::FactoryBase::AllocateRawArray(int, v8::internal::AllocationType) [io.history.0]
2022-05-01 18:57:30.418 - error: host.iobroker-VM03 Caught by controller[7]: 11: 0xd4aa54 v8::internal::FactoryBase::NewFixedArrayWithFiller(v8::internal::Handle, int, v8::internal::Handle, v8::internal::AllocationType) [io.history.0]
2022-05-01 18:57:30.418 - error: host.iobroker-VM03 Caught by controller[8]: 12: 0xf80ffe v8::internal::Handle v8::internal::HashTable::New(v8::internal::Isolate*, int, v8::internal::AllocationType, v8::internal::MinimumCapacity) [io.history.0]
2022-05-01 18:57:30.418 - error: host.iobroker-VM03 Caught by controller[9]: 13: 0xf81cf9 v8::internal::Handle v8::internal::BaseNameDictionary::New(v8::internal::Isolate*, int, v8::internal::AllocationType, v8::internal::MinimumCapacity) [io.history.0]
2022-05-01 18:57:30.418 - error: host.iobroker-VM03 Caught by controller[9]: 14: 0xf35be1 v8::internal::JSObject::MigrateToMap(v8::internal::Isolate*, v8::internal::Handle, v8::internal::Handle, int) [io.history.0]
2022-05-01 18:57:30.418 - error: host.iobroker-VM03 Caught by controller[9]: 15: 0xf556cc v8::internal::LookupIterator::Delete() [io.history.0]
2022-05-01 18:57:30.418 - error: host.iobroker-VM03 Caught by controller[9]: 16: 0xf2c55b v8::internal::JSReceiver::DeleteProperty(v8::internal::LookupIterator*, v8::internal::LanguageMode) [io.history.0]
2022-05-01 18:57:30.418 - error: host.iobroker-VM03 Caught by controller[9]: 17: 0x10b4600 v8::internal::Runtime::DeleteObjectProperty(v8::internal::Isolate*, v8::internal::Handle, v8::internal::Handle, v8::internal::LanguageMode) [io.history.0]
2022-05-01 18:57:30.418 - error: host.iobroker-VM03 Caught by controller[9]: 18: 0x10b673a v8::internal::Runtime_DeleteProperty(int, unsigned long*, v8::internal::Isolate*) [io.history.0]
2022-05-01 18:57:30.418 - error: host.iobroker-VM03 Caught by controller[9]: 19: 0x1448e19 [io.history.0]
2022-05-01 18:57:30.418 - warn: host.iobroker-VM03 instance system.adapter.history.0 terminated due to SIGABRT
2022-05-01 18:57:30.418 - info: host.iobroker-VM03 instance system.adapter.history.0 terminated with code NaN ()
2022-05-01 18:57:30.418 - info: host.iobroker-VM03 Restart adapter system.adapter.history.0 because enabled
2022-05-01 18:58:00.450 - info: host.iobroker-VM03 instance system.adapter.history.0 started with pid 323469
dann die tausend Meldungen enabled logging of....
ein paar wenige debug mit found alias
zwischendrin noch
2022-05-01 18:58:09.706 - debug: history.0 (323704) Redis Objects: Use Redis connection: 0.0.0.0:9001
2022-05-01 18:58:09.729 - debug: history.0 (323704) Objects client ready ... initialize now
2022-05-01 18:58:09.730 - debug: history.0 (323704) Objects create System PubSub Client
2022-05-01 18:58:09.731 - debug: history.0 (323704) Objects create User PubSub Client
2022-05-01 18:58:09.731 - debug: history.0 (323704) Objects client initialize lua scripts
2022-05-01 18:58:09.746 - debug: history.0 (323704) Objects connected to redis: 0.0.0.0:9001
2022-05-01 18:58:09.750 - debug: history.0 (323704) objectDB connected
2022-05-01 18:58:09.751 - debug: history.0 (323704) Redis States: Use Redis connection: 0.0.0.0:9000
2022-05-01 18:58:09.758 - debug: history.0 (323704) States create System PubSub Client
2022-05-01 18:58:09.759 - debug: history.0 (323704) States create User PubSub Client
2022-05-01 18:58:09.768 - debug: history.0 (323704) States connected to redis: 0.0.0.0:9000
2022-05-01 18:58:09.768 - debug: history.0 (323704) statesDB connected
2022-05-01 18:58:09.996 - debug: history.0 (323704) Plugin sentry Initialize Plugin (enabled=true)
und dann wieder:
Hat lange gedauert, aber habe ich das richtig verstanden, dass erst der gesamte Tag eingelesen wird, mit allen DPs?
Das sind bei mir etwa 50MB -
@homoran kann das sein das auch deine Vis so oft alles neu lädt?!
Also die Abfolge passt ja. Zuerst der Crash (was genau loggt er denn VOR dem Crash??) dann startet er neu, aktiviert alle datenpunkte und dann kommen ggf von Vis oder admin Dinge rein.
ich schaue heute Abend nochmal log weil an sich sollte das alles nicht sooooo wild sein mit RAM weil an sich die datenabfrage und nem extra Prozess passiert.
-
Hi All,
GitHub hat nochmal ein paar nderungen erfahren - primär im Umgang mit dem Abfragen von Daten und versucht dort Dinge zu optimieren. Version bleibt weiterhin 2.0.0
-
@apollon77
Hallo,Super, dass der Adapter überarbeitet wird. Endlich!!! Juhuuu.
Was mir immer wieder passiert ist,
dass irgendein Sensor Mist in die History schreibt, die Daten versaut und die Diagramme unbrauchbar macht.Es wäre wünschenswert, wenn man
-
Datenpunkte aus der History per UI löschen, ändern und hinzufügen könnte.
-
beim Editieren von Datenpunkte in der History DB, muss natürlich auch der Zeitpunkt änderbar sein.
-
Was auch noch super wäre, wenn man alle Datenpunkte, die man logt an einer Stelle, nämlich dem Adapter wiederfinden würde und dort zentral verwalten könnte.
Man muss jedesmal in den Verzeichnisbäumen der Datenpunkte suchen, das nervt total und ist unübersichtlich. Was mir auch schon passiert ist, dass ich einen Datenpunkt vergessen habe, und der hat mir dann die Harddisk voll gemacht.
Ich bin mir nicht ganz sicher, ob das im Change Log beinhaltet ist. Habe es aber beim Überfliegen nicht gefunden.
Und ein verwandtes Thema: alle Grafik Module für VIS können max nur 2 Jahre darstellen. Flot kann, wenn man die URL umständlich editiert auch 9 Jahre darstellen. Es wäre schön, wenn man dieses Defizit auch beheben könnte.
Liebe Grüße
Martin
-

