Tuya Adapter ohne Echtzeit Aktualisierung
-
Systemdata Bitte Ausfüllen Hardwaresystem: Pi1B+ Arbeitsspeicher: 512MB Festplattenart: SD-Karte Betriebssystem: Raspian Node-Version: 12.22.12 Nodejs-Version: 12.22.12 NPM-Version: 7.5.2 Installationsart: Skript Image genutzt: Nein Ort/Name der Imagedatei: Link Servus zusammen,
habe für mein Balkonkraftwerk eine Green Sun Smart Plug die in Smart Life App problemlos läuft. Im iobroker habe ich mir den tuya Adapter installiert und meine Tuya Geräte über die Cloud gesynct. Auch den Tuya IOT Account habe ich angelegt, aber alles was ich bekomme sind vereinzelt Datenpunkte.Läuft das bei jemandem von Euch?
Falls ja, habt Ihr eine Idee was bei mir falsch ist?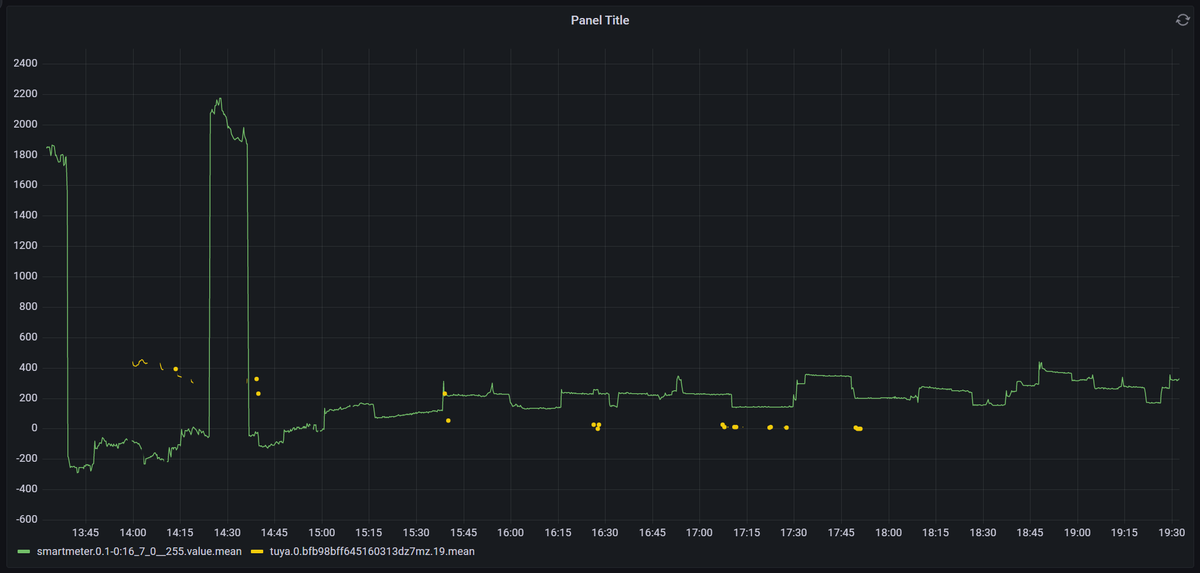
Danke + Grüße
Flo -
Nodejs-Version: 12.22.12
NPM-Version: 7.5.2Ist mit ziemlicher Sicherheit falsch.
Installier da erstmal eine saubere Basis. -
@florian-b sagte: 512MB
Darauf soll ioBroker laufen?
-
@paul53 sagte in Tuya Adapter ohne Echtzeit Aktualisierung:
Darauf soll ioBroker laufen?
Ja, aber nicht besonders geschmeidig.
")
Könnte mit 'Echtzeit' etwas schwierig werden.
-
Also die Versionen sind schon richtig:
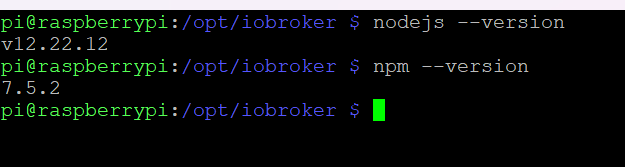
Passen die nicht zusammen?
Ja, der Raspberry ist ein altes Ding aber für die Visualisierung reicht er.
Interessant ist jedenfalls, wenn ich die App am Handy öffne, dann klappts auch mit Echtzeit Datenpunkt (siehe um 14 Uhr im Screenshot). -
Nein, die passen nicht zusammen. Wie auch immer du das hingebastelt hast...
iob diagsagt? Da ist bestimmt noch anderes 'optimierungsbedürftig'.
Vollausgabe in codetags, nicht als Screenshot!Dem Ding mutest du auch noch einen X-Server für eine vis zu?
-
Pi1 ist auch ein 'Sonderfall' was nodejs angeht.
Näheres im Link aus meiner Signatur. -
Nein, keinen X-Server.. mit Grafana, läuft gschmeidig!
")
Hier der Diag Output:
======== Start marking the full check here ========= Skript v.2023-01-02 *** BASE SYSTEM *** Model : Raspberry Pi Model B Rev 2 Architecture: armv6l Docker: false Virtualization: none Distributor ID: Raspbian Description: Raspbian GNU/Linux 11 (bullseye) Release: 11 Codename: bullseye PRETTY_NAME="Raspbian GNU/Linux 11 (bullseye)" NAME="Raspbian GNU/Linux" VERSION_ID="11" VERSION="11 (bullseye)" VERSION_CODENAME=bullseye ID=raspbian ID_LIKE=debian HOME_URL="http://www.raspbian.org/" SUPPORT_URL="http://www.raspbian.org/RaspbianForums" BUG_REPORT_URL="http://www.raspbian.org/RaspbianBugs" Systemuptime and Load: 20:12:39 up 2 days, 5:36, 2 users, load average: 3.66, 3.69, 3.79 CPU threads: 2 *** Time and Time Zones *** Fri Mar 17 19:12:39 UTC 2023 Fri Mar 17 20:12:39 CET 2023 CET +0100 Europe/Berlin *** User and Groups *** pi /home/pi pi adm dialout cdrom sudo audio video plugdev games users input render netdev lpadmin gpio i2c spi iobroker *** X-Server-Setup *** X-Server: false Desktop: Terminal: tty Boot Target: graphical.target *** MEMORY *** total used free shared buff/cache available Mem: 429M 211M 100M 0.0K 118M 173M Swap: 1.1G 345M 778M Total: 1.6G 556M 879M 429 M total memory 211 M used memory 137 M active memory 145 M inactive memory 99 M free memory 9 M buffer memory 108 M swap cache 1123 M total swap 345 M used swap 778 M free swap *** FILESYSTEM *** df: /mnt/nfs: Host is down Filesystem Type Size Used Avail Use% Mounted on /dev/root ext4 7.1G 6.6G 167M 98% / devtmpfs devtmpfs 87M 0 87M 0% /dev tmpfs tmpfs 215M 0 215M 0% /dev/shm tmpfs tmpfs 86M 1008K 85M 2% /run tmpfs tmpfs 5.0M 4.0K 5.0M 1% /run/lock /dev/mmcblk0p1 vfat 255M 51M 205M 20% /boot tmpfs tmpfs 43M 16K 43M 1% /run/user/1000 Messages in dmesg: [Wed Mar 15 14:35:56 2023] Kernel command line: coherent_pool=1M snd_bcm2835.enable_compat_alsa=0 snd_bcm2835.enable_hdmi=1 video=Composite-1:720x480@60i vc_mem.mem_base=0x1ec00000 vc_mem.mem_size=0x20000000 console=ttyAMA0,115200 console=tty1 root=PARTUUID=cc9d61f0-02 rootfstype=ext4 fsck.repair=yes rootwait quiet splash plymouth.ignore-serial-consoles [Wed Mar 15 14:35:59 2023] EXT4-fs (mmcblk0p2): mounted filesystem with ordered data mode. Opts: (null). Quota mode: none. [Wed Mar 15 14:35:59 2023] VFS: Mounted root (ext4 filesystem) readonly on device 179:2. [Wed Mar 15 14:36:08 2023] EXT4-fs (mmcblk0p2): re-mounted. Opts: (null). Quota mode: none. Show mounted filesystems (real ones only): TARGET SOURCE FSTYPE OPTIONS / /dev/mmcblk0p2 ext4 rw,noatime |-/boot /dev/mmcblk0p1 vfat rw,relatime,fmask=0022,dmask=0022,codepage=437,iocharset=ascii,shortname=mixed,errors=remount-ro `-/mnt/nfs //192.168.2.1/backup cifs rw,relatime,vers=1.0,cache=strict,username=backup,domain=NAS,uid=0,noforceuid,gid=0,noforcegid,addr=192.168.2.1,soft,unix,posixpaths,serverino,mapposix,acl,rsize=61440,wsize=65536,bsize=1048576,echo_interval=60,actimeo=1 Files in neuralgic directories: /var: 1.6G /var/ 1.1G /var/log 758M /var/log/journal/095ae9a8b4eb4c7cb71d821a78a34687 758M /var/log/journal 210M /var/lib /opt/iobroker/backups: 4.0K /opt/iobroker/backups/ /opt/iobroker/iobroker-data: 47M /opt/iobroker/iobroker-data/ 27M /opt/iobroker/iobroker-data/backup-objects 15M /opt/iobroker/iobroker-data/files 13M /opt/iobroker/iobroker-data/files/admin.admin/custom/static/js 13M /opt/iobroker/iobroker-data/files/admin.admin/custom/static The five largest files in iobroker-data are: 6.3M /opt/iobroker/iobroker-data/files/admin.admin/custom/static/js/vendors-node_modules_iobroker_adapter-react-v5_assets_devices_parseNames_js-node_modules_iobr-99c23e.847b8ad9.chunk.js.map 3.5M /opt/iobroker/iobroker-data/objects.jsonl 2.8M /opt/iobroker/iobroker-data/files/admin.admin/custom/static/js/vendors-node_modules_iobroker_adapter-react-v5_assets_devices_parseNames_js-node_modules_iobr-99c23e.847b8ad9.chunk.js 2.6M /opt/iobroker/iobroker-data/states.jsonl 1.6M /opt/iobroker/iobroker-data/files/admin.admin/custom/static/js/vendors-node_modules_mui_material_Accordion_index_js-node_modules_mui_material_AccordionDetai-57e02d.0886b730.chunk.js.map *** NodeJS-Installation *** /usr/bin/nodejs v12.22.12 /usr/bin/node v12.22.12 /usr/bin/npm 7.5.2 /usr/bin/npx 7.5.2 nodejs: Installed: 12.22.12~dfsg-1~deb11u1 Candidate: 12.22.12~dfsg-1~deb11u3 Version table: 12.22.12~dfsg-1~deb11u3 500 500 http://raspbian.raspberrypi.org/raspbian bullseye/main armhf Packages *** 12.22.12~dfsg-1~deb11u1 100 100 /var/lib/dpkg/status Temp directories causing npm8 problem: 0 *** ioBroker-Installation *** ioBroker Status iobroker is running on this host. Objects type: jsonl States type: jsonl Core adapters versions js-controller: 4.0.24 admin: 6.3.5 javascript: "javascript" not found Adapters from github: 0 Adapter State + system.adapter.admin.0 : admin : raspberrypi - enabled, port: 8081, bind: 0.0.0.0, run as: admin + system.adapter.backitup.0 : backitup : raspberrypi - enabled + system.adapter.discovery.0 : discovery : raspberrypi - enabled + system.adapter.influxdb.0 : influxdb : raspberrypi - enabled, port: 8086 + system.adapter.smartmeter.0 : smartmeter : raspberrypi - enabled + system.adapter.tuya.0 : tuya : raspberrypi - enabled + instance is alive Enabled adapters with bindings + system.adapter.admin.0 : admin : raspberrypi - enabled, port: 8081, bind: 0.0.0.0, run as: admin + system.adapter.influxdb.0 : influxdb : raspberrypi - enabled, port: 8086 ioBroker-Repositories stable : http://download.iobroker.net/sources-dist.json beta : http://download.iobroker.net/sources-dist-latest.json Active repo(s): stable Installed ioBroker-Instances Unable to increase LUA script timeout: Connection is closed. Cannot determine Set feature status: Connection is closed. Connection is closed. Uncaught Rejection: Error: States DB is not allowed to start in the current Multihost environment at Redis.<anonymous> (/opt/iobroker/node_modules/@iobroker/db-states-redis/lib/states/statesInRedisClient.js:579:23) at processTicksAndRejections (internal/process/task_queues.js:97:5) Unable to subscribe to expiry Keyspace events from Redis Server: Connection is closed. Unable to subscribe to evicted Keyspace events from Redis Server: Connection is closed. Unable to subscribe to meta namespace "meta." changes: Connection is closed. Objects and States Please stand by - This may take a while Objects: 283 States: 223 *** OS-Repositories and Updates *** W: An error occurred during the signature verification. The repository is not updated and the previous index files will be used. GPG error: https://packages.grafana.com/enterprise/deb stable InRelease: The following signatures couldn't be verified because the public key is not available: NO_PUBKEY 9E439B102CF3C0C6 W: Failed to fetch https://packages.grafana.com/enterprise/deb/dists/stable/InRelease The following signatures couldn't be verified because the public key is not available: NO_PUBKEY 9E439B102CF3C0C6 W: Some index files failed to download. They have been ignored, or old ones used instead. Hit:1 http://archive.raspberrypi.org/debian bullseye InRelease Hit:2 http://raspbian.raspberrypi.org/raspbian bullseye InRelease Get:3 https://packages.grafana.com/enterprise/deb stable InRelease [5984 B] Err:3 https://packages.grafana.com/enterprise/deb stable InRelease The following signatures couldn't be verified because the public key is not available: NO_PUBKEY 9E439B102CF3C0C6 Reading package lists... W: An error occurred during the signature verification. The repository is not updated and the previous index files will be used. GPG error: https://packages.grafana.com/enterprise/deb stable InRelease: The following signatures couldn't be verified because the public key is not available: NO_PUBKEY 9E439B102CF3C0C6 W: Failed to fetch https://packages.grafana.com/enterprise/deb/dists/stable/InRelease The following signatures couldn't be verified because the public key is not available: NO_PUBKEY 9E439B102CF3C0C6 W: Some index files failed to download. They have been ignored, or old ones used instead. Pending Updates: 116 *** Listening Ports *** Active Internet connections (only servers) Proto Recv-Q Send-Q Local Address Foreign Address State User Inode PID/Program name tcp 0 0 127.0.0.1:8088 0.0.0.0:* LISTEN 116 10601 336/influxd tcp 0 0 127.0.0.1:9001 0.0.0.0:* LISTEN 1001 13841 337/iobroker.js-con tcp 0 0 127.0.0.1:9000 0.0.0.0:* LISTEN 1001 13865 337/iobroker.js-con tcp 0 0 0.0.0.0:22 0.0.0.0:* LISTEN 0 11782 370/sshd: /usr/sbin tcp 0 0 127.0.0.1:631 0.0.0.0:* LISTEN 0 790991 5054/cupsd tcp6 0 0 :::3000 :::* LISTEN 117 14015 333/grafana-server tcp6 0 0 ::1:631 :::* LISTEN 0 790990 5054/cupsd tcp6 0 0 :::8081 :::* LISTEN 1001 18615 613/io.admin.0 tcp6 0 0 :::8086 :::* LISTEN 116 14073 336/influxd tcp6 0 0 :::22 :::* LISTEN 0 11797 370/sshd: /usr/sbin udp 0 0 0.0.0.0:68 0.0.0.0:* 0 13745 275/dhcpcd udp 0 0 0.0.0.0:631 0.0.0.0:* 0 791052 5055/cups-browsed udp 0 0 0.0.0.0:5353 0.0.0.0:* 108 9876 240/avahi-daemon: r udp 0 0 0.0.0.0:51437 0.0.0.0:* 108 9878 240/avahi-daemon: r udp 0 0 0.0.0.0:6666 0.0.0.0:* 1001 507125 4252/io.tuya.0 udp 0 0 0.0.0.0:6667 0.0.0.0:* 1001 507126 4252/io.tuya.0 udp6 0 0 :::5353 :::* 108 9877 240/avahi-daemon: r udp6 0 0 :::33319 :::* 108 9879 240/avahi-daemon: r *** Log File - Last 25 Lines *** 2023-03-17 20:41:04.365 - info: smartmeter.0 (627) Received 5 values, 2 updated 2023-03-17 20:41:05.076 - info: smartmeter.0 (627) Received 5 values, 2 updated 2023-03-17 20:41:05.095 - info: smartmeter.0 (627) Received 5 values, 2 updated 2023-03-17 20:41:05.586 - info: smartmeter.0 (627) Received 5 values, 2 updated 2023-03-17 20:41:06.604 - info: smartmeter.0 (627) Received 5 values, 2 updated 2023-03-17 20:41:06.778 - info: smartmeter.0 (627) Received 5 values, 2 updated 2023-03-17 20:41:09.967 - info: smartmeter.0 (627) Received 5 values, 2 updated 2023-03-17 20:41:10.042 - info: smartmeter.0 (627) Received 5 values, 2 updated 2023-03-17 20:41:10.813 - info: smartmeter.0 (627) Received 5 values, 2 updated 2023-03-17 20:41:10.833 - info: smartmeter.0 (627) Received 5 values, 2 updated 2023-03-17 20:41:11.909 - info: smartmeter.0 (627) Received 5 values, 2 updated 2023-03-17 20:41:13.799 - info: smartmeter.0 (627) Received 5 values, 2 updated 2023-03-17 20:41:13.864 - info: smartmeter.0 (627) Received 5 values, 2 updated 2023-03-17 20:41:15.605 - info: smartmeter.0 (627) Received 5 values, 2 updated 2023-03-17 20:41:15.628 - info: smartmeter.0 (627) Received 5 values, 2 updated 2023-03-17 20:41:19.115 - info: smartmeter.0 (627) Received 5 values, 2 updated 2023-03-17 20:41:19.176 - info: smartmeter.0 (627) Received 5 values, 2 updated 2023-03-17 20:41:21.023 - info: smartmeter.0 (627) Received 5 values, 2 updated 2023-03-17 20:41:22.533 - info: smartmeter.0 (627) Received 5 values, 2 updated 2023-03-17 20:41:23.090 - info: smartmeter.0 (627) Received 5 values, 2 updated 2023-03-17 20:41:25.215 - info: smartmeter.0 (627) Received 5 values, 2 updated 2023-03-17 20:41:25.812 - info: smartmeter.0 (627) Received 5 values, 2 updated 2023-03-17 20:41:25.854 - info: smartmeter.0 (627) Received 5 values, 2 updated 2023-03-17 20:41:26.374 - info: smartmeter.0 (627) Received 5 values, 2 updated 2023-03-17 20:41:27.760 - info: smartmeter.0 (627) Received 5 values, 2 updated ============ Mark until here for C&P ============= iob diag has finished. -
@florian-b sagte in Tuya Adapter ohne Echtzeit Aktualisierung:
Bis auf
Pending Updates: 116
schaut das besser aus als befürchtet.
Ich würde alle nodejs-Pakete aus dem Paketmanager kicken und dann ein aktuelles nodejs als 'Sonderfall'-Installation manuell installieren.sudo apt remove node-* nodejs npm nodejs-docUnd das Grafana-Repo zuvor aktualisieren:
https://forum.iobroker.net/topic/62040/linux-debian-grafana-repo-muss-aktualisiert-werden
Dann kannst da auch wieder Updates reinschaufeln.
