HowTo: Zusatz-Programme fuer jarvis v3
-
@mcu top. Danke Dir.
-
@der-eine
v1.0.3 mit Popup für 5 Sekunden.

-
@mcu cool danke Dir funktioniert!

-
@der-eine Falls man die Farben nicht mag kann man sie anpassen, background und textColor.
-
@mcu danke hab ich gestern gesehen.
-
@mcu hast Du noch nie Idee, wie man die Hörbücher zurücksetzen kann wenn man am "Ende" angekommen ist ausser über ein Dropdown?
-
@der-eine v1.0.4 - mit Restart Button -> Folge = 1
-
@mcu danke werd ich gleich anschauen.
-
@TheNeon Wir machen bitte hier weiter.
SenderListe in einem jsonTable ist so ähnlich wie die Hörspiele.
https://mcuiobroker.gitbook.io/jarvis-infos/jarvis-v3/system-effektprog./jsontable-alexa-horspieleEs wird nur keine Liste gebraucht, was gespielt wurde.
-
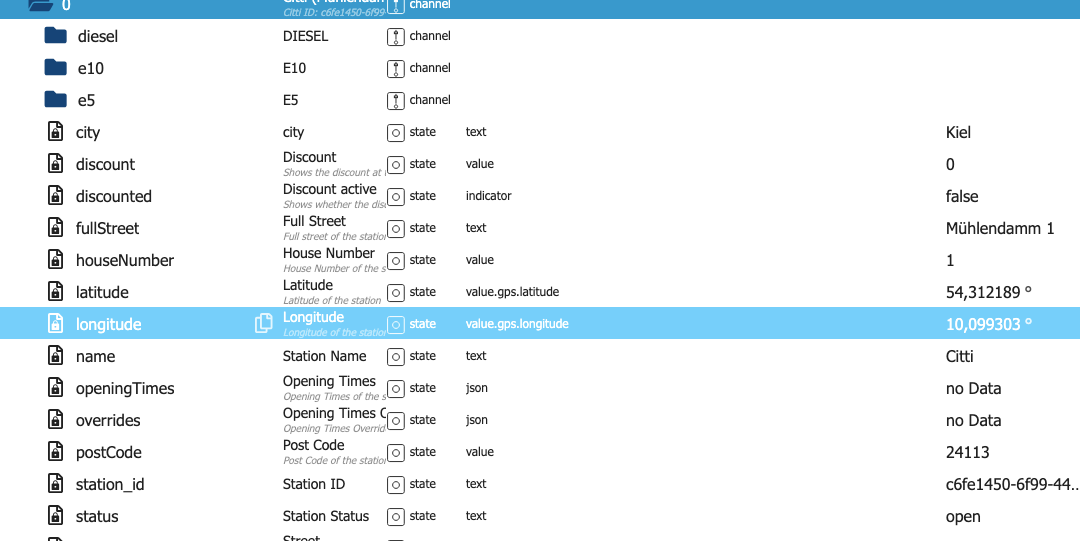
@mcu Interesse das Tankerkönig Script https://mcuiobroker.gitbook.io/jarvis-infos/jarvis-v3/system-effektprog./tankerkoenig/javscript-tankerkoenighighlight
um die Straße zu ergänzen?
In größeren Städten - wie Kiel - gibt es mehrere Shell und Jet Tankstellen, die je nach Lage auch unterschiedliche Preise haben.JARIVS 3.1.8
ioBroker 7.6.17
Tankerkönig Adapter 3.4.0 -
@recaremo Das musst du als Feature in github für den tankerkoenig-Adapter mal empfehlen.
Ich nutze den DPtankerkoenig.0.stations.jsonTablefür die Verarbeitung. Dort ist keine Street mit drin und auch keine ID. Also kann ich von meiner Seite aus nichts machen, es wäre auch nur Raten.evtl. hier ergänzen
https://github.com/iobroker-community-adapters/ioBroker.tankerkoenig/issues/116EDIT: habe doch noch eine Möglichkeit gefunden
-
@recaremo Wonach soll noch sortiert werden?
Erstmal v1.0.2 erstellt. -
@mcu said in HowTo: Zusatz-Programme fuer jarvis v3:
@recaremo Das musst du als Feature in github für den tankerkoenig-Adapter mal empfehlen.
Ich nutze den DPtankerkoenig.0.stations.jsonTablefür die Verarbeitung. Dort ist keine Street mit drin und auch keine ID. Also kann ich von meiner Seite aus nichts machen, es wäre auch nur Raten.evtl. hier ergänzen
https://github.com/iobroker-community-adapters/ioBroker.tankerkoenig/issues/116EDIT: habe doch noch eine Möglichkeit gefunden
Bei meine Adapter von Tankerkönig wird die Straße und einiges mehr angezeigt.
-
-
Tolle Erweiterungen des Scriptes -inzwischen Tankerkönig 1.03.
https://mcuiobroker.gitbook.io/jarvis-infos/jarvis-v3/system-effektprog./tankerkoenig#v1.0.3
Vielen Dank.
-
@mabbi Übernommen von https://forum.iobroker.net/topic/39172/test-echarts-adapter/648
Zeig mal die Presets in echarts.0 und die Objekteigenschaften zum echarts.0.D_Energie_copy. In CodeTags </>.
Also echartDP muss schon mal '0_userdata.0.echarts'; sein, sonst kann es ja nicht funktionieren.
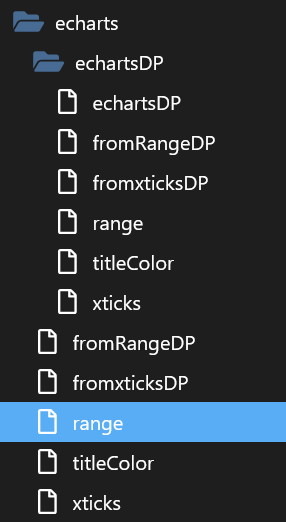
Da hast du ein wenig mit dem echartDP gespielt -> muss du komplett löschen
Und den echartDP so lassen wie er war ->'0_userdata.0.echarts'; -
@Mabbi

Expertenmodus einschalten

und dann die Objekt daten in Codetags
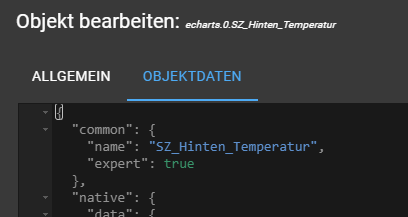
-
@mcu: Ich bin mir nicht ganz sicher, was gemeint ist .... ?

{ "common": { "read": true, "write": true, "name": "eCharts-DP", "type": "string", "role": "state", "def": "" }, "native": {}, "type": "state", "from": "system.adapter.javascript.0", "user": "system.user.admin", "ts": 1755774987903, "_id": "0_userdata.0.echarts.echartsDP", "acl": { "object": 1636, "state": 1636, "owner": "system.user.admin", "ownerGroup": "system.group.administrator" } } -
@mabbi Sorry von energie, du woltest ja das erstmal nutzen

-
{
  "common": {
    "name": "D_Energie copy"
  },
  "native": {
    "url": "",
    "data": {
      "lines": [
        {
          "name": "Leistung gesamt",
          "id": "0_userdata.0.Datenpunkte.PV.Leistung_gesamt",
          "instance": "system.adapter.sql.0",
          "thickness": "1",
          "chartType": "auto",
          "aggregate": "max",
          "isBoolean": null,
          "symbolSize": 3,
          "validTime": "",
          "unit": "  kW",
          "color": "#1a98a6",
          "fill": 0.2,
          "shadowsize": "",
          "min": "-14",
          "max": "20",
          "ignoreNull": "0",
          "noFuture": false,
          "percentile": 50,
          "integralUnit": 60,
          "integralInterpolation": "none",
          "yticks": "-1",
          "xaxe": "",
          "xticks": "6",
          "yOffset": "0",
          "points": false,
          "hide": false,
          "yaxe": "left",
          "convert": "val / 1000",
          "afterComma": "3"
        },
        {
          "name": "EV-Ladestrom",
          "id": "0_userdata.0.Datenpunkte.EV_Wallbox.EV-Ladestrom",
          "instance": "system.adapter.history.0",
          "thickness": "1",
          "chartType": "auto",
          "aggregate": "max",
          "isBoolean": null,
          "symbolSize": 3,
          "validTime": "",
          "fill": 0.2,
          "min": "-8",
          "max": "22",
          "convert": "val / 1000 * -1",
          "color": "#702ce6",
          "xticks": "4",
          "commonYAxis": "0",
          "ignoreNull": "0"
        },
        {
          "name": "Eigenverbrauch",
          "id": "0_userdata.0.Datenpunkte.Strom.Eigenverbrauch",
          "instance": "system.adapter.sql.0",
          "thickness": "1",
          "chartType": "auto",
          "aggregate": "onchange",
          "isBoolean": null,
          "symbolSize": 3,
          "validTime": 35,
          "fill": 0.2,
          "min": "-8",
          "max": "22",
          "convert": "val / 1000 * -1",
          "color": "#00687d",
          "xticks": "4",
          "commonYAxis": "0",
          "ignoreNull": "0"
        },
        {
          "name": "Netzbezug",
          "id": "0_userdata.0.Datenpunkte.Strom.Netzbezug",
          "instance": "system.adapter.sql.0",
          "thickness": "1",
          "chartType": "auto",
          "aggregate": "onchange",
          "isBoolean": null,
          "symbolSize": 3,
          "validTime": 35,
          "fill": 0.3,
          "min": "-8",
          "max": "22",
          "convert": "val / 1000 * -1",
          "color": "#b82124",
          "xticks": "4",
          "commonYAxis": "0",
          "ignoreNull": "0",
          "afterComma": ""
        },
        {
          "name": "Einspeisung",
          "id": "0_userdata.0.Datenpunkte.Strom.Einspeisung",
          "instance": "system.adapter.sql.0",
          "thickness": "1",
          "chartType": "auto",
          "aggregate": "onchange",
          "isBoolean": null,
          "symbolSize": 3,
          "validTime": 35,
          "fill": 0.2,
          "min": "-8",
          "max": "22",
          "convert": "val / 1000",
          "color": "#10952f",
          "xticks": "4",
          "commonYAxis": "0",
          "ignoreNull": "0"
        },
        {
          "name": "Klima Buero OG Betrieb",
          "id": "0_userdata.0.Datenpunkte.Temperatur-Steuerung.Klima_Buero_OG_Betrieb",
          "instance": "system.adapter.sql.0",
          "thickness": "1",
          "chartType": "line",
          "aggregate": "minmax",
          "isBoolean": null,
          "symbolSize": 3,
          "validTime": "",
          "fill": 1,
          "min": "0",
          "max": "10",
          "convert": "val * 0.25",
          "color": "#008b47",
          "xticks": "4",
          "commonYAxis": "",
          "ignoreNull": "false",
          "yOffset": "0",
          "percentile": 50,
          "integralUnit": 60,
          "integralInterpolation": "none"
        },
        {
          "name": "Klima Buero Betrieb",
          "id": "0_userdata.0.Datenpunkte.Temperatur-Steuerung.Klima_Buero_Betrieb",
          "instance": "system.adapter.sql.0",
          "thickness": "1",
          "chartType": "line",
          "aggregate": "minmax",
          "isBoolean": null,
          "symbolSize": 3,
          "validTime": "",
          "fill": 1,
          "min": "0",
          "max": "10",
          "convert": "(val * 0.125)",
          "color": "#007583",
          "xticks": "4",
          "commonYAxis": "",
          "ignoreNull": "false",
          "yOffset": "0"
        }
      ],
      "marks": [
        {
          "color": "#5c1011",
          "lineId": "0",
          "upperValueOrId": "-2",
          "lowerValueOrId": "",
          "fill": 0,
          "lineStyle": "dotted",
          "text": "2 KW ",
          "textSize": "10",
          "textColor": "#9b2e2f"
        },
        {
          "color": "#5c1011",
          "lineId": "0",
          "upperValueOrId": "-4",
          "lowerValueOrId": "",
          "fill": 0,
          "lineStyle": "dotted",
          "text": "4 KW ",
          "textSize": "10",
          "textColor": "#9b2e2f"
        },
        {
          "color": "#5c1011",
          "lineId": "0",
          "upperValueOrId": "-6",
          "lowerValueOrId": "",
          "fill": 0,
          "lineStyle": "dotted",
          "text": "6 KW ",
          "textSize": "10",
          "textColor": "#9b2e2f"
        },
        {
          "color": "#1d6923",
          "lineId": "0",
          "upperValueOrId": "2",
          "lowerValueOrId": "",
          "fill": 0,
          "lineStyle": "dotted",
          "text": "2 KW ",
          "textSize": "10",
          "textColor": "#1d6923"
        },
        {
          "color": "#1d6923",
          "lineId": "0",
          "upperValueOrId": "4",
          "lowerValueOrId": "",
          "fill": 0,
          "lineStyle": "dotted",
          "text": "4 KW ",
          "textSize": "10",
          "textColor": "#1d6923"
        },
        {
          "color": "#1d6923",
          "lineId": "0",
          "upperValueOrId": "6",
          "lowerValueOrId": "",
          "fill": 0,
          "lineStyle": "dotted",
          "text": "6 KW ",
          "textSize": "10",
          "textColor": "#1d6923"
        },
        {
          "color": "#1d6923",
          "lineId": "0",
          "upperValueOrId": "8",
          "lowerValueOrId": "",
          "fill": 0,
          "lineStyle": "dotted",
          "text": "8 KW ",
          "textSize": "10",
          "textColor": "#1d6923"
        },
        {
          "color": "#1d6923",
          "lineId": "0",
          "upperValueOrId": "10",
          "lowerValueOrId": "",
          "fill": 0,
          "lineStyle": "dotted",
          "text": "10 KW ",
          "textSize": "10",
          "textColor": "#1d6923"
        },
        {
          "color": "#1d6923",
          "lineId": "0",
          "upperValueOrId": "12",
          "lowerValueOrId": "",
          "fill": 0,
          "lineStyle": "dotted",
          "text": "12 KW ",
          "textSize": "10",
          "textColor": "#1d6923"
        },
        {
          "color": "#1d6923",
          "lineId": "0",
          "upperValueOrId": "14",
          "lowerValueOrId": "",
          "fill": 0,
          "lineStyle": "dotted",
          "text": "14 KW ",
          "textSize": "10",
          "textColor": "#1d6923"
        },
        {
          "color": "#1d6923",
          "lineId": "0",
          "upperValueOrId": "16",
          "lowerValueOrId": "",
          "fill": 0,
          "lineStyle": "dotted",
          "text": "16 KW ",
          "textSize": "10",
          "textColor": "#1d6923"
        },
        {
          "color": "#1d6923",
          "lineId": "0",
          "upperValueOrId": "18",
          "lowerValueOrId": "",
          "fill": 0,
          "lineStyle": "dotted",
          "text": "18 KW ",
          "textSize": "10",
          "textColor": "#1d6923"
        },
        {
          "color": "#5c1011",
          "lineId": "0",
          "upperValueOrId": "-8",
          "lowerValueOrId": "",
          "fill": 0,
          "lineStyle": "dotted",
          "text": "8 KW ",
          "textSize": "10",
          "textColor": "#9b2e2f"
        },
        {
          "color": "#5c1011",
          "lineId": "0",
          "upperValueOrId": "-10",
          "lowerValueOrId": "",
          "fill": 0,
          "lineStyle": "dotted",
          "text": "10 KW ",
          "textSize": "10",
          "textColor": "#9b2e2f"
        },
        {
          "color": "#5c1011",
          "lineId": "0",
          "upperValueOrId": "-12",
          "lowerValueOrId": "",
          "fill": 0,
          "lineStyle": "dotted",
          "text": "12 KW ",
          "textSize": "10",
          "textColor": "#9b2e2f"
        },
        {
          "color": "#5c1011",
          "lineId": "0",
          "upperValueOrId": "-14",
          "lowerValueOrId": "",
          "fill": 0,
          "lineStyle": "dotted",
          "text": "14 KW ",
          "textSize": "10",
          "textColor": "#9b2e2f"
        },
        {
          "color": "#1d6923",
          "lineId": "0",
          "upperValueOrId": "20",
          "lowerValueOrId": "",
          "fill": 0,
          "lineStyle": "dotted",
          "text": "20 KW ",
          "textSize": "10",
          "textColor": "#1d6923"
        }
      ],
      "timeType": "relative",
      "relativeEnd": "now",
      "range": "1440",
      "aggregateType": "step",
      "aggregateSpan": "1",
      "legend": "",
      "hoverDetail": true,
      "zoom": true,
      "animation": 0,
      "live": "300",
      "ticks": "",
      "width": "",
      "height": "",
      "noBorder": "",
      "window_bg": "#000000",
      "bg_custom": "",
      "x_labels_color": "",
      "y_labels_color": "",
      "border_color": "#343434",
      "grid_color": "",
      "grid_hideX": true,
      "grid_hideY": true,
      "border_width": "5",
      "barColor": "",
      "barLabels": "topover",
      "barWidth": "",
      "barFontSize": "",
      "barFontColor": "",
      "title": "",
      "titlePos": "",
      "titleColor": "",
      "titleSize": "",
      "legColumns": "",
      "legBgOpacity": "",
      "legBg": "",
      "timeFormat": "",
      "export": false,
      "legendDirection": "",
      "useComma": false,
      "noBackground": true,
      "legActual": false,
      "legFontSize": "",
      "legendHeight": "",
      "resetZoom": "600",
      "autoGridPadding": false,
      "theme": "default",
      "hoverNoInterpolate": false,
      "hoverNoNulls": false,
      "timeFormatCustom": false,
      "border_style": "ridge",
      "border_padding": "5"
    }
  },
  "type": "chart",
  "_id": "echarts.0.D_Energie_copy",
  "acl": {
    "object": 1636,
    "owner": "system.user.admin",
    "ownerGroup": "system.group.administrator"
  },
  "from": "system.adapter.admin.0",
  "user": "system.user.admin",
  "ts": 1755630349601
}

