[gelöst] ioB 120% Auslastung und no connection to database
-
@thomas-braun
erledigt...thorsten@ioBroker2:~$ sudo apt remove redis-tools redis-server Paketlisten werden gelesen... Fertig Abhängigkeitsbaum wird aufgebaut. Statusinformationen werden eingelesen.... Fertig Die folgenden Pakete wurden automatisch installiert und werden nicht mehr benötigt: libhiredis0.14 libjemalloc2 liblua5.1-0 linux-image-4.19.0-16-amd64 linux-image-4.19.0-17-amd64 linux-image-4.19.0-18-amd64 lua-bitop lua-cjson Verwenden Sie »sudo apt autoremove«, um sie zu entfernen. Die folgenden Pakete werden ENTFERNT: redis-server redis-tools 0 aktualisiert, 0 neu installiert, 2 zu entfernen und 0 nicht aktualisiert. Nach dieser Operation werden 2.607 kB Plattenplatz freigegeben. Möchten Sie fortfahren? [J/n] j (Lese Datenbank ... 69740 Dateien und Verzeichnisse sind derzeit installiert.) Entfernen von redis-server (5:5.0.14-1+deb10u2) ... Entfernen von redis-tools (5:5.0.14-1+deb10u2) ... Trigger für man-db (2.8.5-2) werden verarbeitet ... thorsten@ioBroker2:~$@apollon77
dann schau ich mal was die SMART-Werte meiner NEUEN M.2-SSD sagen...externe SSD hab ich erst ersetzt, ist dem Hitzetod erlegen im Serverschrank...danach dann iob starten mit Admin, rest deaktiviert...ich melde mich mit weiteren Erkenntnissen.DANKE EUCH ganz herzlich für eure Unterstützung

-
@kueppert Bin gespannt ...
M2.SSD welcher Hersteller?
") Hab bei SSDs auch schon krasse geschwindigkeitsunterschiede erlebt ... bin daher nur noch bei Samsung
Hab bei SSDs auch schon krasse geschwindigkeitsunterschiede erlebt ... bin daher nur noch bei Samsung -
@apollon77 Transcend...dachte das reicht aus das Teil...SMART sieht für mich bis auf die CRC-Fehler erst mal top aus
root@proxmox:~# smartctl --scan /dev/sda -d scsi # /dev/sda, SCSI device root@proxmox:~# smartctl -a /dev/sda smartctl 7.2 2020-12-30 r5155 [x86_64-linux-5.13.19-4-pve] (local build) Copyright (C) 2002-20, Bruce Allen, Christian Franke, www.smartmontools.org === START OF INFORMATION SECTION === Model Family: Silicon Motion based SSDs Device Model: TS256GMSA230S Serial Number: G986570236 LU WWN Device Id: 5 7c3548 1dc0963fc Firmware Version: R0427GN1 User Capacity: 256,060,514,304 bytes [256 GB] Sector Size: 512 bytes logical/physical Rotation Rate: Solid State Device Form Factor: M.2 TRIM Command: Available, deterministic, zeroed Device is: In smartctl database [for details use: -P show] ATA Version is: ACS-3 T13/2161-D revision 5 SATA Version is: SATA 3.3, 6.0 Gb/s (current: 6.0 Gb/s) Local Time is: Fri Apr 22 13:15:27 2022 CEST SMART support is: Available - device has SMART capability. SMART support is: Enabled === START OF READ SMART DATA SECTION === SMART overall-health self-assessment test result: PASSED General SMART Values: Offline data collection status: (0x80) Offline data collection activity was never started. Auto Offline Data Collection: Enabled. Self-test execution status: ( 0) The previous self-test routine completed without error or no self-test has ever been run. Total time to complete Offline data collection: ( 0) seconds. Offline data collection capabilities: (0x7b) SMART execute Offline immediate. Auto Offline data collection on/off support. Suspend Offline collection upon new command. Offline surface scan supported. Self-test supported. Conveyance Self-test supported. Selective Self-test supported. SMART capabilities: (0x0002) Does not save SMART data before entering power-saving mode. Supports SMART auto save timer. Error logging capability: (0x01) Error logging supported. General Purpose Logging supported. Short self-test routine recommended polling time: ( 2) minutes. Extended self-test routine recommended polling time: ( 30) minutes. Conveyance self-test routine recommended polling time: ( 2) minutes. SMART Attributes Data Structure revision number: 16 Vendor Specific SMART Attributes with Thresholds: ID# ATTRIBUTE_NAME FLAG VALUE WORST THRESH TYPE UPDATED WHEN_FAILED RAW_VALUE 1 Raw_Read_Error_Rate 0x0000 100 100 000 Old_age Offline - 0 5 Reallocated_Sector_Ct 0x0000 100 100 000 Old_age Offline - 0 9 Power_On_Hours 0x0000 100 100 000 Old_age Offline - 410 12 Power_Cycle_Count 0x0000 100 100 000 Old_age Offline - 13 148 Total_SLC_Erase_Ct 0x0000 100 100 000 Old_age Offline - 140 149 Max_SLC_Erase_Ct 0x0000 100 100 000 Old_age Offline - 12 150 Min_SLC_Erase_Ct 0x0000 100 100 000 Old_age Offline - 3 151 Average_SLC_Erase_Ct 0x0000 100 100 000 Old_age Offline - 9 159 DRAM_1_Bit_Error_Count 0x0000 100 100 000 Old_age Offline - 0 160 Uncorrectable_Error_Cnt 0x0000 100 100 000 Old_age Offline - 0 161 Valid_Spare_Block_Cnt 0x0000 100 100 000 Old_age Offline - 33 163 Initial_Bad_Block_Count 0x0000 100 100 000 Old_age Offline - 24 164 Total_Erase_Count 0x0000 100 100 000 Old_age Offline - 13059 165 Max_Erase_Count 0x0000 100 100 000 Old_age Offline - 50 166 Min_Erase_Count 0x0000 100 100 000 Old_age Offline - 2 167 Average_Erase_Count 0x0000 100 100 000 Old_age Offline - 28 168 Max_Erase_Count_of_Spec 0x0000 100 100 000 Old_age Offline - 1000 169 Remaining_Lifetime_Perc 0x0000 100 100 000 Old_age Offline - 98 177 Wear_Leveling_Count 0x0000 100 100 050 Old_age Offline - 0 181 Program_Fail_Cnt_Total 0x0000 100 100 000 Old_age Offline - 0 182 Erase_Fail_Count_Total 0x0000 100 100 000 Old_age Offline - 0 192 Power-Off_Retract_Count 0x0000 100 100 000 Old_age Offline - 1 194 Temperature_Celsius 0x0000 100 100 000 Old_age Offline - 41 195 Hardware_ECC_Recovered 0x0000 100 100 000 Old_age Offline - 0 196 Reallocated_Event_Count 0x0000 100 100 016 Old_age Offline - 0 199 UDMA_CRC_Error_Count 0x0000 100 100 050 Old_age Offline - 0 232 Available_Reservd_Space 0x0000 100 100 000 Old_age Offline - 100 241 Host_Writes_32MiB 0x0000 100 100 000 Old_age Offline - 32766 242 Host_Reads_32MiB 0x0000 100 100 000 Old_age Offline - 104072 245 TLC_Writes_32MiB 0x0000 100 100 000 Old_age Offline - 235062 SMART Error Log Version: 1 No Errors Logged SMART Self-test log structure revision number 1 No self-tests have been logged. [To run self-tests, use: smartctl -t] SMART Selective self-test log data structure revision number 1 SPAN MIN_LBA MAX_LBA CURRENT_TEST_STATUS 1 0 0 Not_testing 2 0 0 Not_testing 3 0 0 Not_testing 4 0 0 Not_testing 5 0 0 Completed [00% left] (0-65535) Selective self-test flags (0x0): After scanning selected spans, do NOT read-scan remainder of disk. If Selective self-test is pending on power-up, resume after 0 minute delay. -
@kueppert sagte in ioBroker mit 120% Auslastung und no connection to database:
TS256GMSA230S
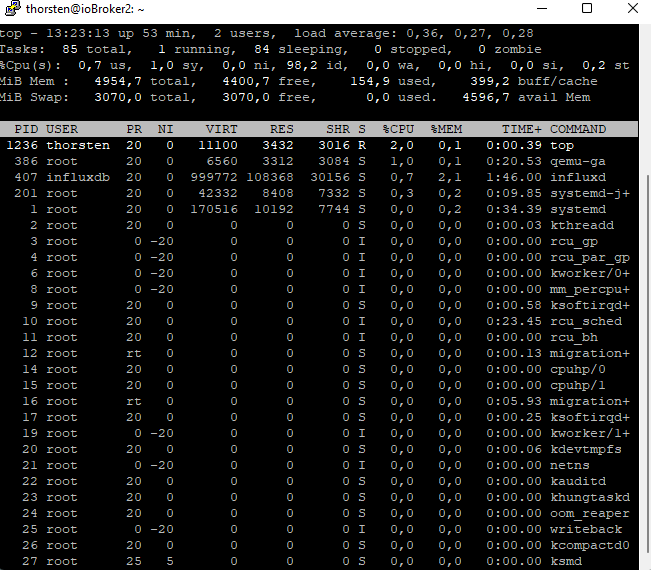
wie sieht das top denn aus wenn nichts läuft? irgendwo müssen die 30% CPU ja herkommen
-
@apollon77 iobroker stop alarm.0 führt zu 85% Auslastung und dauert >60 Sekunden hahahaha
TOP sieht absolut unauffällig aus:
wenn ich nen Adapter beende:
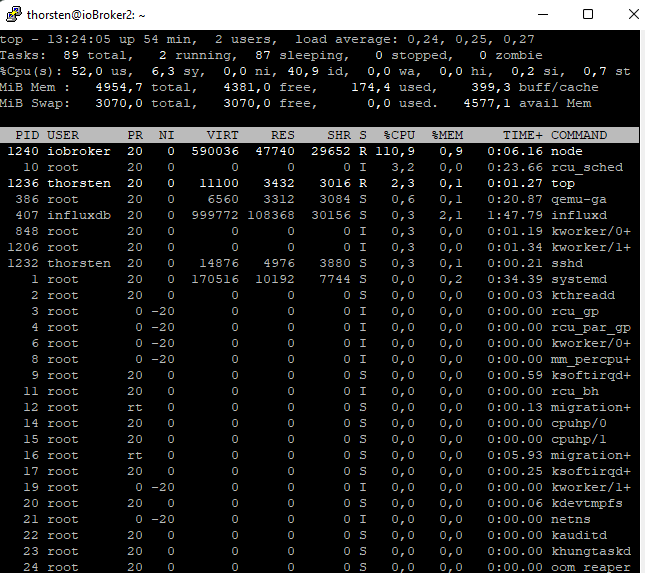
geht danach aber direkt wieder runter auf 5% nach paar Sekunden...der Prozess dauert trotzdem über 1 Minute (Adapter-Stop)
ah, jetzt ist node wieder über 100%...Adapter ist gestoppt, node wieder auf <1% -
@kueppert Na dann lass alarm.0 mal aus und schau den Rest an ... denn muss man dann gesondert prüfen, ggf mit debug log oder so
-
@apollon77 der Stop aller Adapter, die ich jetzt durch habe, dauert so lang...
thorsten@ioBroker2:~$ iobroker stop alarm.0 The adapter "alarm.0" was stopped. thorsten@ioBroker2:~$ ^C thorsten@ioBroker2:~$ iobroker stop proxmox.0 The adapter "proxmox.0" was stopped. thorsten@ioBroker2:~$ iobroker stop influxdb.0 The adapter "influxdb.0" was stopped. thorsten@ioBroker2:~$ iobroker stop unifi.0 The adapter "unifi.0" was stopped. -
@kueppert Aahhh das meinst du ... das Stoppen von alarm dauert ... ok blöd.
Ja ... weil iobroker nicht läuft muss er jedes mal die DB öffnen und alles hochfahren und dann ists wieder aus ... sorry

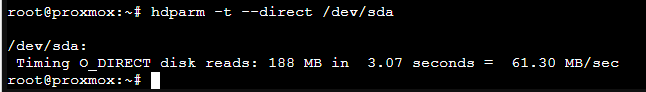
Aber dann ist irgendwas mit dem storage ... der liest doch nur 80MB
EDIT: Das ganze würde bei mir aber immer mehr darauf kommen das es kein Adapter ist sondern irgendwas mit deinem Storage
-
@apollon77 okay...danke für den Hinweis. Ich geh mal auf die Suche nach ner SAMSUNG!! M.2 SSD
")
-
Vllt wäre mal ne Idee das Du auf proxmox ebvene nen "Lese-Durchsatz test" der M2 machst?
-
@apollon77 sieht eigentlich gut aus?
-
@apollon77
ICH BIN DRIIIIIN hab paar Adapter gestoppt. Dann noch nen Update von Proxmox hinterher geschoben, den ganzen NUC neu gestartet...Auslastung VM liegt bei 13% aktuell...jetzt mal schauen, was passiert, wenn ich die Adapter wieder starte...
Adapter laufen alle wieder, Auslastung ~20%
Abruf des iob status in der Konsole auch wieder gewohnt sehr schnell... -
Na dann viel Spass beim weiter beobachten
