TibberLink Adapter
-
... heute z.B. habe ich bis 8:00 massig Fehler im Protokoll, ab da alles prima mit dem Demo Token
-
Das Problem ist gelöst!
Ich hatte das gleiche Problem mit meinem richtigen Token, den wollte ich aber hier nicht veröffentlichen. Das Bild hat nur als Beispiel gedient.
Zusätzlich zu Iobroker habe ich noch Evcc laufen, welcher auch Daten bei Tibber abfragt. Die hatten anscheinend das Timeoutintervall verändert und so kam es zum Problem. Evcc hat das direkt gefixt und jetzt läuft alles wieder.
Vielen Dank für eure Mühe, schönen Sonntag! -
Hallo Community,
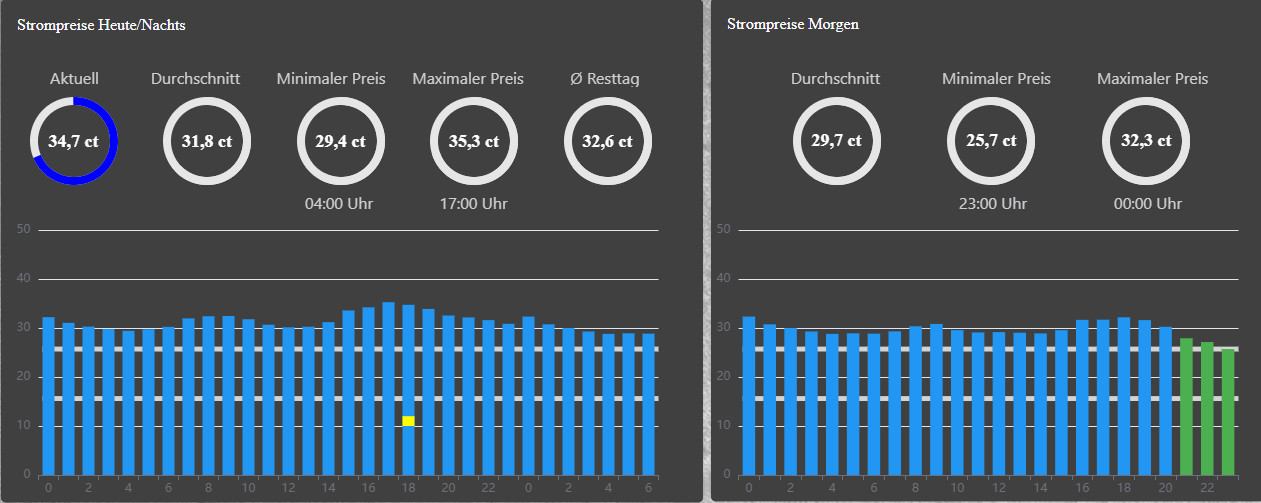
Ich überlege wie man die Visualisierungs-Möglichkeiten der Preisdaten verbessern könnte...
Wie macht ihr das? In VIS-2 habe ich keine so recht gute Idee dazu....In VIS-1 könnte ich mir an der Stelle gut vorstellen die Preisdaten kombiniert anzubieten als JSON. Jeweils Preise heute und morgen kombiniert, sofern vorhanden. Es würde für einen spezifischen Config Teil des Graphen dann einen einzubettenden JSON Block geben, (im Beispiel von "type": "bar" bis "yAxis_maximumDigits": 3) der in der Admin-Console eingegeben werden kann:
{
  "graphs": [
  {
    "data": [
      0.228,
      0.336,
      0.348,
      0.281
    ],
    "type": "bar",
    .........
    "yAxis_maximumDigits": 3
  }],
  "axisLabels": [
    "28.12. 09:00",
    "28.12. 10:00",
    "28.12. 11:00",
    "28.12. 12:00"
  ]
}
die Axis Labels und Data fügt der Adapter dann hinzu und gibt das ganze als "jsonGraph" in die Struktur ... denke das wird ein neuer Folder PricesTotal....
Evtl. noch ein weiterer JSON state in den Folder für e-charts Konformität (VIS-2)?
"jsonECharts"[ {"t": 1735370280000, "y": 0.228}, {"t": 1735372800000, "y": 0.336}, {"t": 1735376400000, "y": 0.348}, {"t": 1735380000000, "y": 0.281} ]Was meinst Ihr?
-
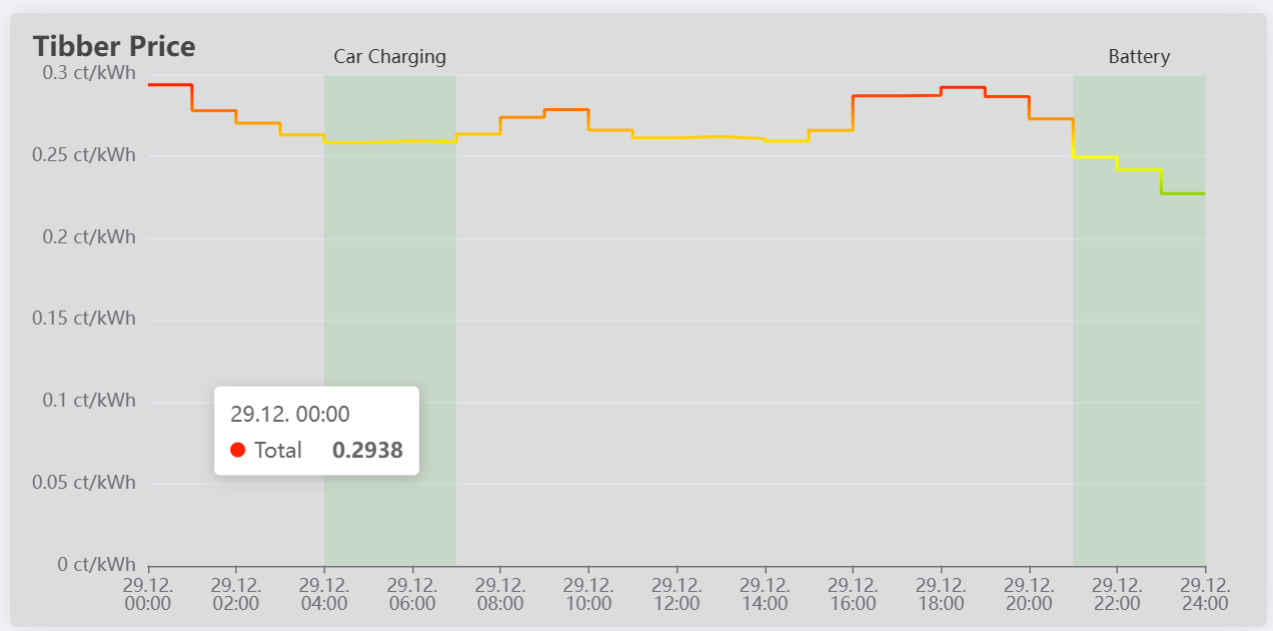
Ich lasse aktuell ein Flexchart zusammenbauen (Vis2). Nutze das halt nicht nur für den Preis, sondern auch zum Anzeigen, wann das Auto geladen wird (unterschreiten einer einstellbaren Schwelle) und wann der Speicher (der demnächst kommt) geladen bzw. entladen wird.
-
@merlin123 Also das mit dem Flexchart ist echt gut..... und schnell. Ich hatte mit dem E-Charts Adapter probiert mit JSON als Quelle.... das ist definitiv zu langsam....
Mit Flexchart könnte man glatt noch die Automatisierungskanäle mit einbauen....
-
@reblausgt Die Darstellung sieht klasse aus
") Ist die "echt" oder nur mal rumgespielt? Wenn "echt": Kannst Du mal teilen, wie Du die erzeugst?
Ist die "echt" oder nur mal rumgespielt? Wenn "echt": Kannst Du mal teilen, wie Du die erzeugst? -
@merlin123
Nee das ist inzwischen echt.... macht der Adapter 4.2.0 5jetzt durch ansteuern vom FlexChart.... Ich bin nur noch am spielen mit den Beschriftungen, wenn man mehrere Blöcke hat.... da wird das etwas "blöd" mit dem vielen Text...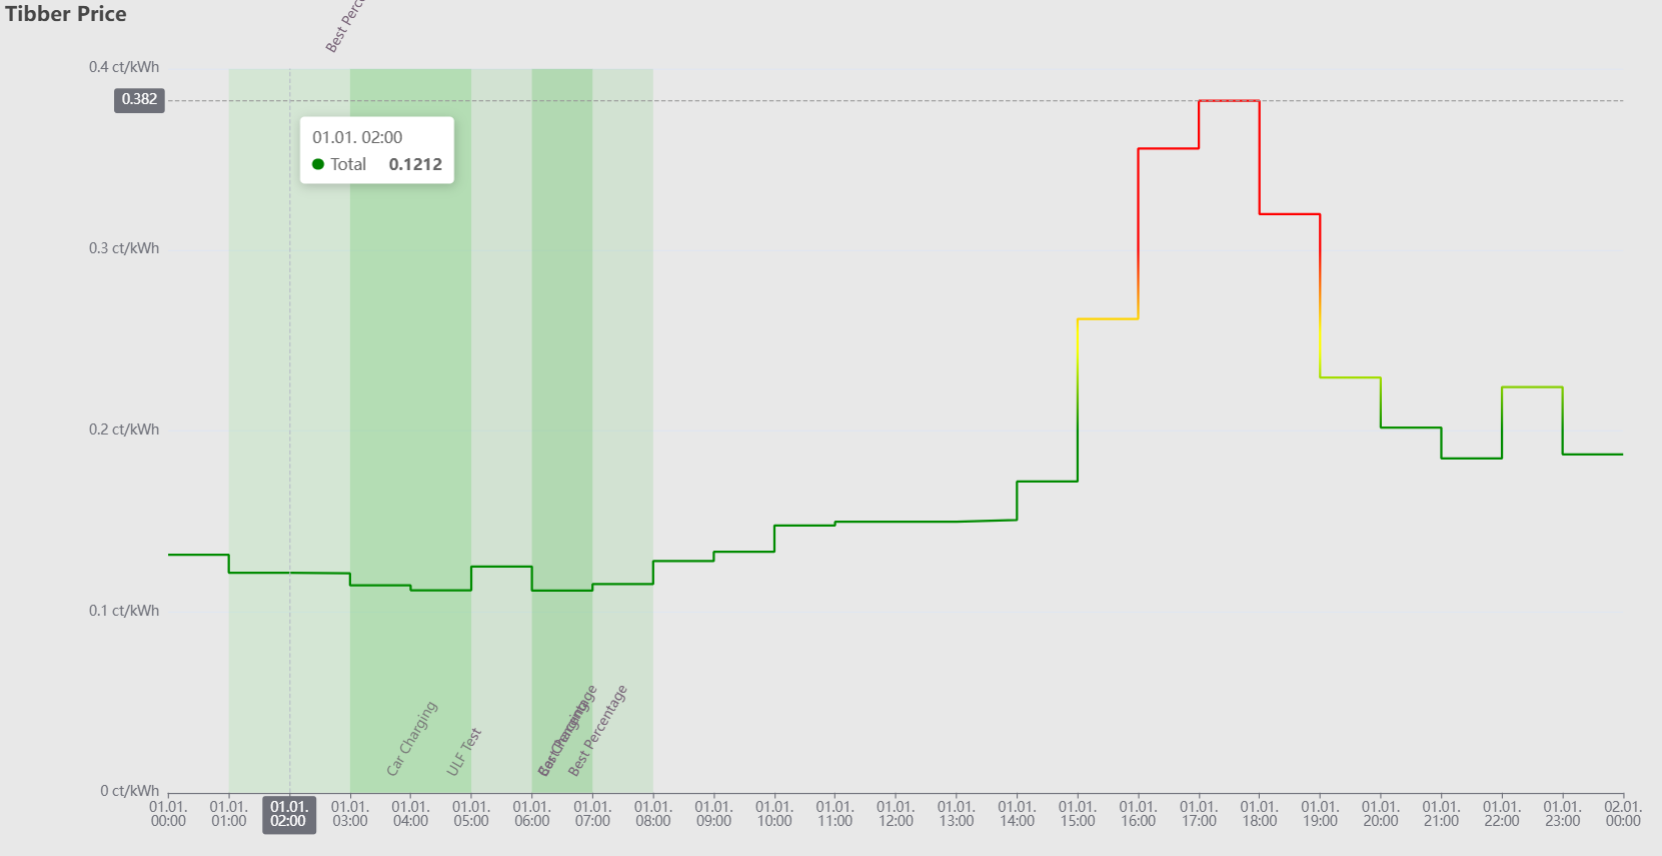 66
66 -
@reblausgt Ah klasse! Schau ich mit im Laufen des Tages mal an.
Frage zu den Rechenfunktionen: Wann werden die ausgelöst?Konkret:
Ich will die "best hours" haben. Werden die aktualisiert wenn der DP mit dem Referenzwert geändert wird?Hab mal kurz reingeschaut:
Wo stelle ich den Vergleichswert dann eigentlich ein?
Einfach den DP (z.B. tibberlink.0.Homes.xxxCalculations.1.TriggerPrice) aktualisieren?Und wo finde ich denn das Chart?
Ist das das da:
tibberlink.0.Homes.xxx.PricesToday.jsonBin da grad etwas planlos

Bonusfrage: Wenn man z.B. noch nen Speicher hat und da anzeigen will, wann der aus dem Netz geladen werden soll und oberhalb welchen Strompreises er erst entladen soll: Ist angedacht das auch visualisierbar zu machen?
-
@reblausgt ich nutze dafür grafana.
Es gibt vorgefertigte Dashboards mit diversen Anzeigemöglichkeiten. Die Daten werden direkt aus der tibber API geholt. -
@bakerman23 sagte in TibberLink Adapter:
@reblausgt ich nutze dafür grafana.
Es gibt vorgefertigte Dashboards mit diversen Anzeigemöglichkeiten. Die Daten werden direkt aus der tibber API geholt.Kannst Du da dann auch anzeigen lassen, wann das Auto geladen werden soll usw.?
-
@merlin123 said in TibberLink Adapter:
@bakerman23 sagte in TibberLink Adapter:
@reblausgt ich nutze dafür grafana.
Es gibt vorgefertigte Dashboards mit diversen Anzeigemöglichkeiten. Die Daten werden direkt aus der tibber API geholt.Kannst Du da dann auch anzeigen lassen, wann das Auto geladen werden soll usw.?
JA.... vorgefertigte in der Mehrzahl ist akut noch dezent übertrieben, aber, ja ich sehe meine Auto Ladung
-
@merlin123 said in TibberLink Adapter:
Frage zu den Rechenfunktionen: Wann werden die ausgelöst?
Konkret:
Ich will die "best hours" haben. Werden die aktualisiert wenn der DP mit dem Referenzwert geändert wird?JA
Wo stelle ich den Vergleichswert dann eigentlich ein?
Einfach den DP (z.B. tibberlink.0.Homes.xxxCalculations.1.TriggerPrice) aktualisieren?Korrekt
Und wo finde ich denn das Chart?
tibberlink.0.Homes.xxx.PricesTotal.jsonFlexCharts
Bonusfrage: Wenn man z.B. noch nen Speicher hat und da anzeigen will, wann der aus dem Netz geladen werden soll und oberhalb welchen Strompreises er erst entladen soll: Ist angedacht das auch visualisierbar zu machen?
Du meinst für den SmartBattery Channel ..... noch nicht implementiert, ab ja, natürlich - will ich doch sehen
")
Akut geht es noch nicht für alle Channel typen.... bin ich dran -
@bakerman23 said in TibberLink Adapter:
@reblausgt ich nutze dafür grafana.
Es gibt vorgefertigte Dashboards mit diversen Anzeigemöglichkeiten. Die Daten werden direkt aus der tibber API geholt.Bin ich voll bei Dir - wenn man den Aufwand mit Grafana - inkl. Server etc. machen will ist das schon ne gute Lösung, aber halt auch deutlich aufwendiger....
Zudem habe ich das jetzt so gestaltet, dass man sich die Daten für zukünftige Schaltzustände jetzt auch einfacher aus dem System holen kann. - denke ich zumindest
-
@reblausgt sagte in TibberLink Adapter:
tibberlink.0.Homes.xxx.PricesTotal.jsonFlexCharts
Irgendwas mache ich falsch... Ich habe jetzt das Template in den JSON Editor der Instanz kopiert (also die 3 Einträge, die da drin waren, durch das Template ersetzt) und es wird auch ein JSON erzeugt.
Versuche ich aber
http://192.168.0.251:8082/flexcharts/echarts.html?source=state&id=tibberlink.0.Homes.xxx.PricesTotal.jsonFlexCharts
in einem iFrame anzuzeigen kommt nix.Das JSON sieht so aus:
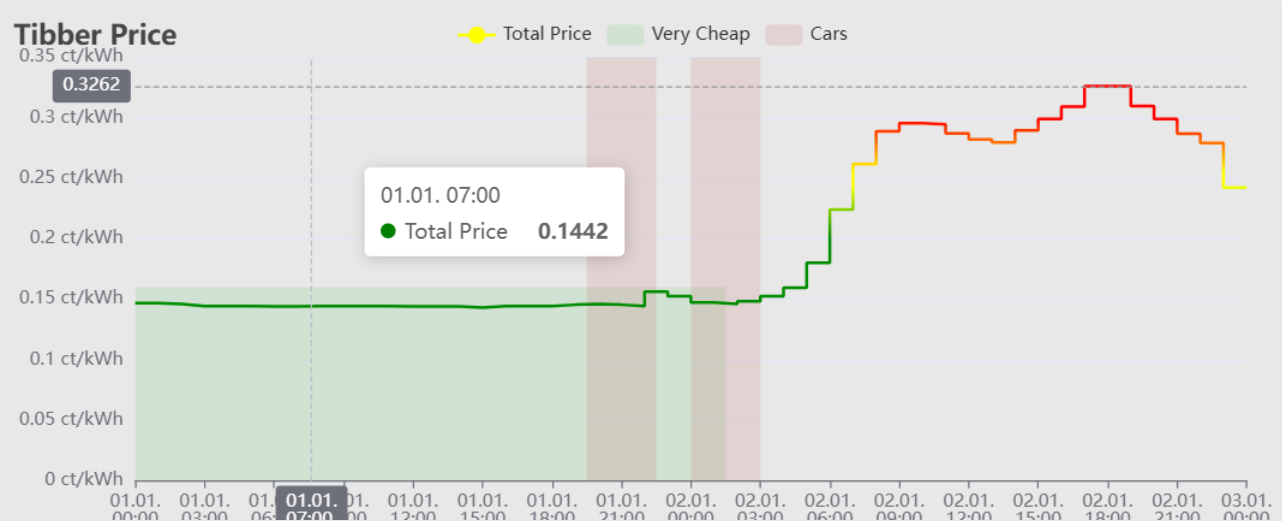
option = {
	backgroundColor: "rgb(232, 232, 232)",
	title: {
		text: "Tibber Price",
	},
	tooltip: {
		trigger: "axis",
		axisPointer: {
			type: "cross"
		}
	},
	grid: { // Randabstände
		left: "10%", right: "4%", top: "8%", bottom: "8%"
	},
	xAxis: {
		type: "category",
		boundaryGap: false,
		data: ["02.01.\n00:00","02.01.\n01:00","02.01.\n02:00","02.01.\n03:00","02.01.\n04:00","02.01.\n05:00","02.01.\n06:00","02.01.\n07:00","02.01.\n08:00","02.01.\n09:00","02.01.\n10:00","02.01.\n11:00","02.01.\n12:00","02.01.\n13:00","02.01.\n14:00","02.01.\n15:00","02.01.\n16:00","02.01.\n17:00","02.01.\n18:00","02.01.\n19:00","02.01.\n20:00","02.01.\n21:00","02.01.\n22:00","02.01.\n23:00","03.01.\n00:00"]
	},
	yAxis: {
		type: "value",
		axisLabel: {formatter: "{value} ct/kWh"},
		axisPointer: {
			snap: true
		}
	},
	visualMap: {
		min: 0.2,
		max: 0.3,
		inRange: {
			color: ["green", "yellow", "red"] // Verlauf von grün über gelb nach rot
		},
		show: false
	},
	series: [
		{
			name: "Total",
			type: "line",
			step: "end",
			symbol: "none",
			data: [0.2059,0.2047,0.207,0.2112,0.218,0.2387,0.2828,0.3205,0.3475,0.3543,0.3532,0.3456,0.3409,0.3384,0.3483,0.3577,0.3678,0.3848,0.3849,0.3685,0.3576,0.3454,0.3378,0.301,0.301],

			markArea: {
				itemStyle: {
					color: "rgba(120, 200, 120, 0.2)"
				},
				data: [
					%%CalcChannelsData%%
				]
			}
		}
	]
};
Was mir auch aufgefallen ist:
Ich habe den TriggerPrice geändert, das Diagramm wurde aber nicht aktualisiert -
Hi!
Wie kann ich denn das hier auswerten?

Vielen Dank!
-
@sms Was meinst Du mit Auswerten? Ist ein JSON, kann man gut mit Blockly zerlegen.
-
@merlin123 und wie? Habe ich noch nie gemacht.
-
@sms said in TibberLink Adapter:
@merlin123 und wie? Habe ich noch nie gemacht.
Wenn ich ein wenig Werbung machen darf.... ChatGPT und seine Brüder sind sehr hilfreich bei solchen Dingen... Blockly kann der aber nicht, er würde direkt JavaScript erstellen... dann aber sehr einfach mit "schau mal die Daten: 'kjdfhshs' ich bräuchte bitte ein Liste der Totalen Kosten mit den Mittelwerten alle 4h und ...."
Was willst Du denn zerlegen? Bzw. was ist das Ziel?
-
@merlin123 said in TibberLink Adapter:
Irgendwas mache ich falsch... Ich habe jetzt das Template in den JSON Editor der Instanz kopiert (also die 3 Einträge, die da drin waren, durch das Template ersetzt) und es wird auch ein JSON erzeugt.
Versuche ich aber
http://192.168.0.251:8082/flexcharts/echarts.html?source=state&id=tibberlink.0.Homes.xxx.PricesTotal.jsonFlexCharts
in einem iFrame anzuzeigen kommt nix.lösch mal das aus dem erzeugten JSON raus und schau ob er es dann darstellt - das wär mal die halbe Miete:
			markArea: {
				itemStyle: {
					color: "rgba(120, 200, 120, 0.2)"
				},
				data: [
					%%CalcChannelsData%%
				]
			}
Es hat bei Dir den Channel Data nicht eingetragen... evtl. hast Du auch nur Channel Typen die noch nicht unterstützt sind (die GIT Version von Gestern Abend kann da schon wieder mehr) - für den Fall dass keine Channel Daten vorhanden sind muss ich den Platzhalter noch passend ersetzen.... sehr gut! Da hast Du einen Bug gefunden
Was mir auch aufgefallen ist:
Ich habe den TriggerPrice geändert, das Diagramm wurde aber nicht aktualisiertStimmt. Die Rohdaten werden schon erzeugt - ich muss nur noch einen Trigger freischalten dass er den jsonFlexCharts neu erstellt (aufgrund der Aufteilung der Programmteile gibt es da noch ein zu umschiffendes Hindernis) - aber das kommt noch... akut hilft ein Adapterneustart zum Probieren, oder die nächste volle Stunde.
Zudem habe ich gestern evtl. eine Lösung gefunden für das "zu viel Text bei mehreren Channels" Problem:
-
@sms sagte: Wie kann ich denn das hier auswerten?
Bitte das komplette JSON in Code tags zeigen und angeben, welche Werte benötigt werden.
EDIT: Beispiel für eine Lesekonvertierung in einem Alias vom Typ "Zahl":
JSON.parse(val)[0].cost
