neue Visualisierung "webui" (alternative zu vis & vis-2)
-
Wo was entfernen? Locale variablen sind weg wenn du den browser neu lädst und die nirgends verwendet sind
-
Jetzt ist es wieder an der Zeit, die Experten zu fragen:
Ich habe mit chart.js mir ein Klasse geschrieben, die mir meine notwendigen Daten in Grafiken umsetzt. Das Ganze habe ich mit rein Javascript gemacht.
Hierzu eine Index.html erstellt:<!DOCTYPE html> <html lang="de"> <head> <meta charset="UTF-8"> <meta name="viewport" content="width=device-width, initial-scale=1.0"> <title>Energieverbrauchs-Diagramm</title> <script src="https://cdn.jsdelivr.net/npm/chart.js"></script> <script src="js/chartBuilder.js"></script> <link rel="stylesheet" href="index.css"> </head> <body> <div id="chartContainer"> <div> <canvas id="houseYearlyChart"></canvas> <div class="legend" id="houseYearlyChartLegend"></div> <!-- Container für die Legende --> </div> <div> <canvas id="roomYearlyChart"></canvas> <div class="legend" id="roomYearlyChartLegend"></div> <!-- Container für die Legende --> </div> <div> <canvas id="roomMonthlyChart"></canvas> <div class="legend" id="roomMonthlyChartLegend"></div> <!-- Container für die Legende --> </div> <div> <canvas id="grossesDiagramm"></canvas> <div class="grossesDiagrammLegend" id="grossesDiagrammLegend"></div> <!-- Container für die Legende --> </div> <div> <canvas id="grossesDiagrammX"></canvas> <div class="grossesDiagrammLegend" id="grossesDiagrammXLegend"></div> <!-- Container für die Legende --> </div> </div> <script src="index.js"> </script> </body> </html>Chart.js als Script-Tag eingebaut, <script src="https://cdn.jsdelivr.net/npm/chart.js"></script>
Meine Klasse hinzugefügt und ein kleines index.js zur Konfiguration der Grafik.const diagrammBasiswerte = { titlecolor: '#ffffff', fontsize: 12, // Schriftgröße: 12px fontfamily: 'Arial', // Schriftart: Arial fontstyle: 'italic', // Schriftstil: kursiv fontweight: 'bold', // Schriftgewicht: fett fontcolor: '#ffffff', maxRotation: 0, minRotation: 0, } const diagramConfigs = { houseYearlyChart: { chartjs_typ: 'bar', // bar oder line chartType: 'yearlyChart', // yearlyChart oder dailyChart datatype: 'absoluteValue', // 'absoluteValue' oder 'Counter' year: '2025', // Jahr aus der Konfiguration month: '', // Nicht erforderlich für yearlyChart threshold: 30, showLegend: true, // Tabelle mit Legende showPoints: false, // Punkte ausblenden devices: JSON.stringify([ // Geräte { id: '7', name: 'Isttemperatur', type: 'absoluteValue', unit: '°C', normalizationFactor: 1, color: '#0000FF' }, ]), options: { datumsformat: { month: 'short' }, // --> 01.Jan.2024 { day: '2-digit', month: 'short', year: 'numeric' } threshold: { label: 'Threshold', type: 'line', borderColor: '#FF0000', borderWidth: 4, fill: false, pointRadius: 0 }, durchschnitt: { label: 'Durchschnitt', type: 'line', borderColor: '#FFFFFF', borderWidth: 2, fill: false, pointRadius: 0 }, scales: { x: { title: { display: true, text: `Zeitraum 2024`, color: diagrammBasiswerte.titlecolor }, ticks: { maxRotation: diagrammBasiswerte.maxRotation, minRotation: diagrammBasiswerte.minRotation, font: { size: diagrammBasiswerte.fontsize, family: diagrammBasiswerte.fontfamily, style: diagrammBasiswerte.fontstyle, weight: diagrammBasiswerte.fontweight, }, color: diagrammBasiswerte.fontcolor, }, }, y: { title: { display: true, text: `Temperatur (°C)`, color: diagrammBasiswerte.titlecolor }, ticks: { font: { size: diagrammBasiswerte.fontsize, family: diagrammBasiswerte.fontfamily, style: diagrammBasiswerte.fontstyle, weight: diagrammBasiswerte.fontweight, }, color: diagrammBasiswerte.fontcolor, }, }, }, }, }, roomYearlyChart: { chartjs_typ: 'bar', chartType: 'yearlyChart', datatype: 'Counter', // 'absoluteValue' oder 'Counter' year: '2024', // Jahr aus der Konfiguration month: '', // Nicht erforderlich für yearlyChart threshold: 300, showLegend: true, showPoints: true, // Punkte einblenden devices: JSON.stringify([ { id: '36', name: 'ac_energie', type: 'Counter', unit: 'kWh', normalizationFactor: 1000, color: '#00FF00' }, { id: '41', name: 'ac_energie_gesamt', type: 'Counter', unit: 'kWh', normalizationFactor: 1000, color: '#FFA500' }, ]), options: { datumsformat: { month: 'short' }, // --> 01.Jan.2024 { day: '2-digit', month: 'short', year: 'numeric' } threshold: { label: 'Threshold', type: 'line', borderColor: '#FF0000', borderWidth: 4, fill: false, pointRadius: 0 }, durchschnitt: { label: 'Durchschnitt', type: 'line', borderColor: '#FFFFFF', borderWidth: 2, fill: false, pointRadius: 0 }, scales: { x: { title: { display: true, text: `Zeitraum 2024`, color: diagrammBasiswerte.titlecolor }, ticks: { maxRotation: diagrammBasiswerte.maxRotation, minRotation: diagrammBasiswerte.minRotation, font: { size: diagrammBasiswerte.fontsize, family: diagrammBasiswerte.fontfamily, style: diagrammBasiswerte.fontstyle, weight: diagrammBasiswerte.fontweight, }, color: diagrammBasiswerte.fontcolor, }, }, y: { title: { display: true, text: `Energie (kWh)`, color: diagrammBasiswerte.titlecolor }, ticks: { font: { size: diagrammBasiswerte.fontsize, family: diagrammBasiswerte.fontfamily, style: diagrammBasiswerte.fontstyle, weight: diagrammBasiswerte.fontweight, }, color: diagrammBasiswerte.fontcolor, }, }, }, }, }, roomMonthlyChart: { chartjs_typ: 'bar', chartType: 'dailyChart', datatype: 'Counter', // 'absoluteValue' oder 'Counter' year: '2025', // Jahr aus der Konfiguration month: '3', // Monat für dailyChart threshold: 10, showLegend: true, showPoints: true, // Punkte einblenden devices: JSON.stringify([ { id: '41', name: 'ac_energie_gesamt', type: 'Counter', unit: 'kWh', normalizationFactor: 1000, color: '#FFFF00' }, { id: '36', name: 'ac_energie', type: 'Counter', unit: 'kWh', normalizationFactor: 1000, color: '#FF00FF' }, ]), options: { datumsformat: { day: '2-digit', month: 'short' }, // --> 01.Apr threshold: { label: 'Threshold', type: 'line', borderColor: '#FF0000', borderWidth: 4, fill: false, pointRadius: 0 }, durchschnitt: { label: 'Durchschnitt', type: 'line', borderColor: '#FFFFFF', borderWidth: 2, fill: false, pointRadius: 0 }, scales: { x: { title: { display: true, text: `Zeitraum 2025`, color: diagrammBasiswerte.titlecolor }, ticks: { maxRotation: diagrammBasiswerte.maxRotation, minRotation: diagrammBasiswerte.minRotation, font: { size: diagrammBasiswerte.fontsize, family: diagrammBasiswerte.fontfamily, style: diagrammBasiswerte.fontstyle, weight: diagrammBasiswerte.fontweight, }, color: diagrammBasiswerte.fontcolor, }, }, y: { title: { display: true, text: `Energie (kWh)`, color: diagrammBasiswerte.titlecolor }, ticks: { font: { size: diagrammBasiswerte.fontsize, family: diagrammBasiswerte.fontfamily, style: diagrammBasiswerte.fontstyle, weight: diagrammBasiswerte.fontweight, }, color: diagrammBasiswerte.fontcolor, }, }, }, }, }, grossesDiagramm: { chartjs_typ: 'line', // bar oder line chartType: 'yearlyChart', // yearlyChart oder dailyChart datatype: 'Counter', // 'absoluteValue' oder 'Counter' year: '2025', // Jahr aus der Konfiguration month: '', // Nicht erforderlich für yearlyChart threshold: 25, showLegend: true, // Tabelle mit Legende showPoints: true, // Punkte ausblenden devices: JSON.stringify([ // Geräte { id: '41', name: 'ac_energie_gesamt', type: 'Counter', unit: '°C', normalizationFactor: 1, color: '#0000FF' }, { id: '21', name: 'ac_energie', type: 'Counter', unit: '°C', normalizationFactor: 1, color: '#FF0000' }, { id: '22', name: 'ac_energie', type: 'Counter', unit: '°C', normalizationFactor: 1, color: '#FFFF00' }, { id: '23', name: 'ac_energie', type: 'Counter', unit: '°C', normalizationFactor: 1, color: '#000000' }, { id: '24', name: 'ac_energie', type: 'Counter', unit: '°C', normalizationFactor: 1, color: '#FF00FF' }, { id: '25', name: 'ac_energie', type: 'Counter', unit: '°C', normalizationFactor: 1, color: '#FFFFFF' }, ]), options: { datumsformat: { month: 'short' }, // --> 01.Jan.2024 { day: '2-digit', month: 'short', year: 'numeric' } threshold: { label: 'Threshold', type: 'line', borderColor: '#FF0000', borderWidth: 4, fill: false, pointRadius: 0 }, durchschnitt: { label: 'Durchschnitt', type: 'line', borderColor: '#FFFFFF', borderWidth: 2, fill: false, pointRadius: 0 }, scales: { x: { title: { display: true, text: `Zeitraum 2024`, color: diagrammBasiswerte.titlecolor }, ticks: { maxRotation: diagrammBasiswerte.maxRotation, minRotation: diagrammBasiswerte.minRotation, font: { size: diagrammBasiswerte.fontsize, family: diagrammBasiswerte.fontfamily, style: diagrammBasiswerte.fontstyle, weight: diagrammBasiswerte.fontweight, }, color: diagrammBasiswerte.fontcolor, }, }, y: { title: { display: true, text: `Temperatur (°C)`, color: diagrammBasiswerte.titlecolor }, ticks: { font: { size: diagrammBasiswerte.fontsize, family: diagrammBasiswerte.fontfamily, style: diagrammBasiswerte.fontstyle, weight: diagrammBasiswerte.fontweight, }, color: diagrammBasiswerte.fontcolor, }, }, }, }, }, grossesDiagrammX: { chartjs_typ: 'line', // bar oder line chartType: 'yearlyChart', // yearlyChart oder dailyChart datatype: 'Counter', // 'absoluteValue' oder 'Counter' year: '2024', // Jahr aus der Konfiguration month: '', // Nicht erforderlich für yearlyChart threshold: 25, showLegend: true, // Tabelle mit Legende showPoints: true, // Punkte ausblenden devices: JSON.stringify([ // Geräte { id: '26', name: 'ac_energie', type: 'Counter', unit: '°C', normalizationFactor: 1, color: '#0000FF' }, { id: '27', name: 'ac_energie', type: 'Counter', unit: '°C', normalizationFactor: 1, color: '#FF0000' }, { id: '28', name: 'ac_energie', type: 'Counter', unit: '°C', normalizationFactor: 1, color: '#FFFF00' }, { id: '29', name: 'ac_energie', type: 'Counter', unit: '°C', normalizationFactor: 1, color: '#000000' }, { id: '30', name: 'ac_energie', type: 'Counter', unit: '°C', normalizationFactor: 1, color: '#FF00FF' }, { id: '31', name: 'ac_energie', type: 'Counter', unit: '°C', normalizationFactor: 1, color: '#FFFFFF' }, ]), options: { datumsformat: { month: 'short' }, // --> 01.Jan.2024 { day: '2-digit', month: 'short', year: 'numeric' } threshold: { label: 'Threshold', type: 'line', borderColor: '#FF0000', borderWidth: 4, fill: false, pointRadius: 0 }, durchschnitt: { label: 'Durchschnitt', type: 'line', borderColor: '#FFFFFF', borderWidth: 2, fill: false, pointRadius: 0 }, scales: { x: { title: { display: true, text: `Zeitraum 2024`, color: diagrammBasiswerte.titlecolor }, ticks: { maxRotation: diagrammBasiswerte.maxRotation, minRotation: diagrammBasiswerte.minRotation, font: { size: diagrammBasiswerte.fontsize, family: diagrammBasiswerte.fontfamily, style: diagrammBasiswerte.fontstyle, weight: diagrammBasiswerte.fontweight, }, color: diagrammBasiswerte.fontcolor, }, }, y: { title: { display: true, text: `Temperatur (°C)`, color: diagrammBasiswerte.titlecolor }, ticks: { font: { size: diagrammBasiswerte.fontsize, family: diagrammBasiswerte.fontfamily, style: diagrammBasiswerte.fontstyle, weight: diagrammBasiswerte.fontweight, }, color: diagrammBasiswerte.fontcolor, }, }, }, }, }, }; // Diagramme erstellen und Daten laden Object.keys(diagramConfigs).forEach((chartId) => { const config = diagramConfigs[chartId]; const apiUrl = `/api/sqlData?devices=${encodeURIComponent(config.devices)}&year=${config.year}&chartType=${config.chartType}${config.chartType === 'dailyChart' ? `&month=${config.month}` : ''}`; fetch(apiUrl) .then((response) => { if (!response.ok) throw new Error(`Fehler: ${response.statusText}`); return response.json(); }) .then((data) => { const chartBuilder = new ChartBuilder(chartId, `${chartId}Legend`); chartBuilder.create(config.chartjs_typ, config.datatype, data, config.showLegend, config.threshold, config.showPoints, config.year, config.options); }) .catch((error) => console.error(`Fehler beim Laden des Diagramms ${chartId}:`, error)); });Jetzt die Frage an die Experten:
Wo und wie binde ich die externen Elemente in webui ein.
<script src="https://cdn.jsdelivr.net/npm/chart.js"></script>
<script src="js/chartBuilder.js"></script>Meine Klasse habe ich als Beispiel einfach im Javascript-Teil des Controls mit eingebunden. Das geht auch bestimmt anders.
Aber wie ich das mit chart.js mache erschließt sich mir nicht. Ich erhalte immer die Meldung, dass Chart nicht existiert.<script src="http://192.168.110.10:8082/webui.0.data/config/additionalfiles/chart.js"></script> <div id="chartContainer" style="position:absolute;left:97px;top:26px;width:476px;height:170px;"> <div> <canvas id="YearlyChart"></canvas> <div class="legend" id="YearlyChartLegend"></div> </div> <script src="http://192.168.110.10:8082/webui.0.widgets/importmap.js"></script> </div>Hier noch das javascript-Modul
/**
* @param {BaseScreenViewerAndControl} instance
*/

const diagrammBasiswerte = {
    titlecolor: '#ffffff',
    fontsize: 12, // Schriftgröße: 12px
    fontfamily: 'Arial', // Schriftart: Arial
    fontstyle: 'italic', // Schriftstil: kursiv
    fontweight: 'bold', // Schriftgewicht: fett
    fontcolor: '#ffffff',
    maxRotation: 0,
    minRotation: 0,
}

const diagramConfigs = {
    YearlyChart: {
        chartjs_typ: 'bar', // bar oder line
        chartType: 'yearlyChart', // yearlyChart oder dailyChart
        datatype: 'absoluteValue', // 'absoluteValue' oder 'Counter'
        year: '2025', // Jahr aus der Konfiguration
        month: '', // Nicht erforderlich für yearlyChart
        threshold: 30,
        showLegend: true, // Tabelle mit Legende
        showPoints: false, // Punkte ausblenden
        devices: JSON.stringify([   // Geräte
            { id: '7', name: 'Isttemperatur', type: 'absoluteValue', unit: '°C', normalizationFactor: 1, color: '#0000FF' },
        ]),
        options: {
            datumsformat: { month: 'short' }, // --> 01.Jan.2024 { day: '2-digit', month: 'short', year: 'numeric' }
            threshold: { label: 'Threshold', type: 'line', borderColor: '#FF0000', borderWidth: 4, fill: false, pointRadius: 0 },
            durchschnitt: { label: 'Durchschnitt', type: 'line', borderColor: '#FFFFFF', borderWidth: 2, fill: false, pointRadius: 0 },
            scales: {
                x: {
                    title: { display: true, text: `Zeitraum 2024`, color: diagrammBasiswerte.titlecolor },
                    ticks: {
                        maxRotation: diagrammBasiswerte.maxRotation,
                        minRotation: diagrammBasiswerte.minRotation,
                        font: {
                            size: diagrammBasiswerte.fontsize,
                            family: diagrammBasiswerte.fontfamily,
                            style: diagrammBasiswerte.fontstyle,
                            weight: diagrammBasiswerte.fontweight,
                        },
                        color: diagrammBasiswerte.fontcolor,
                    },
                },
                y: {
                    title: { display: true, text: `Temperatur (°C)`, color: diagrammBasiswerte.titlecolor },
                    ticks: {
                        font: {
                            size: diagrammBasiswerte.fontsize,
                            family: diagrammBasiswerte.fontfamily,
                            style: diagrammBasiswerte.fontstyle,
                            weight: diagrammBasiswerte.fontweight,
                        },
                        color: diagrammBasiswerte.fontcolor,
                    },
                },
            },
        },
    },
};

export function init(instance,shadowRoot) {
    console.log(instance);
    console.log(shadowRoot);
    console.log(instance.query);
    const cssid = instance._getDomElement('chartContainer');
    console.log(cssid);
    instance.query = "Ich bin blöd";
    console.log(instance.query);
    IOB.setState('0_userdata.0.Funktionen.DatabaseQuery',instance.query);
    const result2 = instance.result;
    console.log(result2);
    const result = IOB.getState('0_userdata.0.Funktionen.DatabaseResult');
    console.log(JSON.stringify(instance,null,2));
    Object.keys(diagramConfigs).forEach((chartId) => {
       const config = diagramConfigs[chartId];
       const data=instance.result
       const chartBuilder = new ChartBuilder(chartId, `${chartId}Legend`,instance);
       chartBuilder.create(instance,config.chartjs_typ, config.datatype, data, config.showLegend, config.threshold, config.showPoints, config.year, config.options);
    });
}

class ChartBuilder {
    constructor(canvasId, legendId,instance) {
        this.ctx = instance._getDomElement(canvasId).getContext('2d');
        // this.ctx = document.getElementById(canvasId).getContext('2d');
        this.chartInstance = null;
        this.legendId = legendId;
    }

    create(instance,chartjs_typ, datatype, data, showLegend, threshold, showPoints, year, options = {}) {
        this.renderChart(instance,chartjs_typ,datatype, data, showLegend, threshold, showPoints, year, options);
    }

    renderChart(instance,chartjs_typ, datatype, data, showLegend, threshold, showPoints, year, options) {
        if (this.chartInstance) this.chartInstance.destroy();

        const legendContainer = instance._getDomElement(this.legendId);
        // const legendContainer = document.getElementById(this.legendId);
        if (!legendContainer) {
            console.error(`Legenden-Element mit ID "${this.legendId}" nicht gefunden.`);
            return;
        }
        legendContainer.style.display = showLegend ? 'block' : 'none';
        legendContainer.innerHTML = ''; // Reset legend

        const labels = [...new Set(data.map((entry) => {
            const formattedDate = new Date(entry.period).toLocaleDateString('de-DE', options.datumsformat);
            if (isNaN(new Date(entry.period).getTime())) {
                console.error(`Invalid Date: ${entry.period}`); // Debugging für fehlerhafte Werte
            }
            return formattedDate;
        }))];

        // Daten nach Geräten gruppieren
        const deviceData = {};
        const statistics = {};

        data.forEach((entry) => {
            if (!deviceData[entry.device_id]) {
                deviceData[entry.device_id] = {
                    label: entry.device_name || 'Unbekanntes Gerät',
                    unit: entry.unit || 'Einheit unbekannt',
                    color: entry.color || '#000000',
                    data: Array(labels.length).fill(0),
                    backgroundColor: entry.color,
                    borderColor: entry.color,
                    fill: false,
                    pointRadius: showPoints ? 5 : 0,
                };

                // Statistikinitialisierung
                statistics[entry.device_id] = {
                    total: 0,
                    count: 0,
                    max: -Infinity,
                    min: Infinity,
                };
            }

            // Datenwerte für das Dataset hinzufügen
            const index = labels.indexOf(new Date(entry.period).toLocaleDateString('de-DE', options.datumsformat));
            if (index >= 0) {
                const normalizedValue = datatype === 'absoluteValue' ? entry.average_value / entry.normalizationFactor : entry.total_value / entry.normalizationFactor; // Differenziere Werte basierend auf Diagrammtyp
                deviceData[entry.device_id].data[index] = normalizedValue;

                // Statistik berechnen
                statistics[entry.device_id].total += normalizedValue;
                statistics[entry.device_id].count += 1;
                statistics[entry.device_id].max = Math.max(statistics[entry.device_id].max, normalizedValue);
                statistics[entry.device_id].min = Math.min(statistics[entry.device_id].min, normalizedValue);
            }
        });

        // Durchschnittslinien und Threshold als Linien-Datensätze
        const averageData = Array(labels.length).fill(
            Object.keys(statistics).reduce((avg, deviceId) => avg + (statistics[deviceId].total / statistics[deviceId].count || 0), 0) / Object.keys(statistics).length
        );
        const thresholdData = Array(labels.length).fill(threshold);

        // Wenn es sich um ein Balkendiagramm handelt, werden Durchschnitt und Threshold als Linien dargestellt
        const additionalDatasets = (chartjs_typ === 'bar' || chartjs_typ === 'line')
            ? [
                {
                    label: options.threshold?.label  ||  'Threshold',
                    data: thresholdData,
                    type: options.threshold?.type  ||  'line', // Linie für Threshold im Balkendiagramm
                    borderColor: options.threshold?.borderColor  ||  '#FF0000',
                    borderWidth: options.threshold?.borderWidth  ||  2,
                    fill: options.threshold?.fill  ||  false,
                    pointRadius: options.threshold?.pointRadius  ||  0,
                },
                {
                    label: options.durchschnitt?.label || 'Durchschnitt',
                    data: averageData,
                    type: options.durchschnitt?.type || 'line', // Linie für Durchschnitt im Balkendiagramm
                    borderColor: options.durchschnitt?.borderColor || '#0000FF',
                    borderWidth: options.durchschnitt?.borderWidth || 2,
                    fill: options.durchschnitt?.label || false,
                    pointRadius: options.durchschnitt?.pointRadius || 0,
                },
            ]
            : [];

        const datasets = [
            ...Object.values(deviceData),
            ...additionalDatasets, // Linien für Balkendiagramme hinzufügen
        ];

        this.chartInstance = new Chart(this.ctx, {
            type: chartjs_typ,
            data: { labels, datasets },
            options: {
                ...options,
                responsive: true,
                plugins: {
                    legend: { display: false }, // Deaktiviere interne Diagrammlegende vollständig
                },
                scales: {
                    x: {

                        ticks: {
                            callback: function(value, index, ticks) {
                                // Verwende die `labels`-Variable direkt in der Callback-Funktion
                                const date = labels[index];
                                return date || 'Invalid Date'; // Fallback für fehlerhafte Werte
                            },
                        },
                        ...options.scales?.x, // Nutze die angepassten X-Achsenoptionen aus der index.html
                    },
                    y: options.scales?.y || {
                        title: { display: true, text: `Werte (${deviceData[Object.keys(deviceData)[0]].unit})` },
                        ticks: {
                            font: {
                                size: 24,
                                family: 'Arial, sans-serif',
                                weight: 'normal',
                            },
                            color: '#ffffff',
                        },
                    },
                },
            },
        });

        // Tabellarische Legende
        legendContainer.innerHTML = `
        <table style="width:100%; border-collapse:collapse;">
          <tr style="background-color:#f4f4f4; text-align:left;">
            <th>Gerät</th>
            <th>Farbe</th>
            <th>Durchschnitt</th>
            <th>Maximum</th>
            <th>Minimum</th>
          </tr>
          ${Object.keys(deviceData).map(deviceId => `
            <tr>
              <td>${deviceData[deviceId].label}</td>
              <td style="background-color:${deviceData[deviceId].color};"></td>
              <td>${(statistics[deviceId].total / statistics[deviceId].count).toFixed(2)} ${deviceData[deviceId].unit}</td>
              <td>${statistics[deviceId].max.toFixed(2)} ${deviceData[deviceId].unit}</td>
              <td>${statistics[deviceId].min.toFixed(2)} ${deviceData[deviceId].unit}</td>
            </tr>
          `).join('')}
        </table>
      `;
    }
}
In der Zeile 193 (this.chartInstance = new Chart(this.ctx, {) steigt das Programm aus, mit der Meldung: Chart existiert nicht.
-
Willst du chartjs von jsdeliver einbinden? Dann wird immer aufs internet zugeriffen wenn du deine Seite öffnest.
Füg am besten meine chartjs webcomponente hinzu, die ist auch im Beispiuel server:
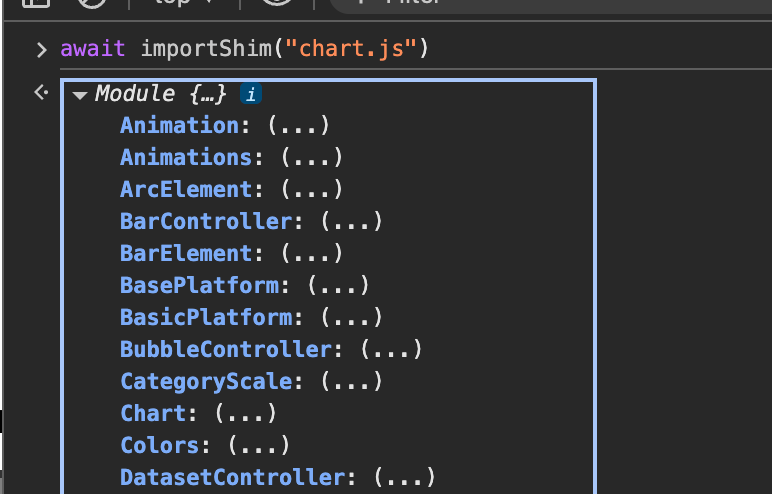
http://129.159.205.3:8082/webui/index.htmlDann solltest du chartjs direkt via: "await importShim("chart.js")" nutzen können.
Aber du kannst natürlich auch direkt meine Komponente nutzen -
(wenn meine Webcomponente hinzugefügt wurde)
-
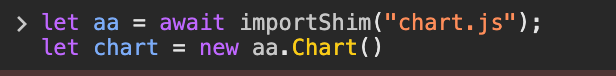
Bspw so:
-
Kann sein, das auch "import" statt "importShim" funktioniert. Kann gerade nur in den dev tools testen. Dort geht nur import, da das script nicht über es-module-shims ausgeführt werden.
Warum importShim? Weil die browser im Moment noch keine dynamischen importmaps supporten, und auch weil sie noch keine importmaps in extra files erlauben: https://github.com/guybedford/es-module-shims
-
@jogibear9988 Hallo Jogibear,
ich musste tatsächlich schmunzeln.- Vielen Dank für deine Lösung. Das hat gut funktioniert.
- Du hast aber meine Frage nicht beantwortet.
Wie würde ich solchen Dinge einbinden, wenn es kein npm-Modul gibt? Insbesondere meine eigenen Klasse?
<script src="js/chartBuilder.js"></script>
-
-
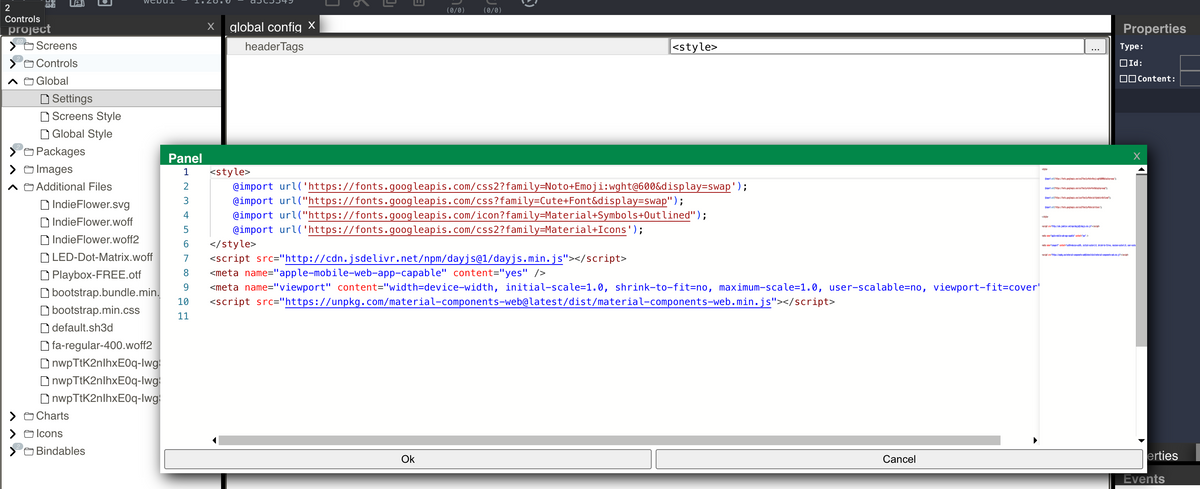
Alles was dort einfügst wird im head hinzugefügt
-
@jogibear9988 Danke schön. Jetzt habe ich alles, was ich brauche.
Deine Lösung mit dem npm-Modul ist natürlich eleganter, was ich auch nutzen werde.
Die Einbindung meiner Klasse hilft mir bei der zentralen Pflege.Grüße