Navigation

    Logo
    • Register
    • Login
    • Search
    • Recent
    • Tags
    • Unread
    • Categories
    • Unreplied
    • Popular
    • GitHub
    • Docu
    • Hilfe
    1. Home
    2. Deutsch
    3. Skripten / Logik
    4. Blockly
    5. json datei für Chart aus vorhandenen DP's erstellen

    NEWS

    • Wir empfehlen: Node.js 22.x

    • Neuer Blog: Fotos und Eindrücke aus Solingen

    • ioBroker goes Matter ... Matter Adapter in Stable

    json datei für Chart aus vorhandenen DP's erstellen

    This topic has been deleted. Only users with topic management privileges can see it.
    • D
      dos1973 @mickym last edited by

      @mickym

      ne das passt nicht.
      Bildschirmfoto 2023-11-09 um 21.05.07.png

      mickym 1 Reply Last reply Reply Quote 0
      • mickym
        mickym Most Active @dos1973 last edited by

        @dos1973 Kannst Du einfach eine DebugNode hinter die list Node machen und mir die payload dann in Code-Tags hier reinkopieren?

        1 Reply Last reply Reply Quote 0
        • mickym
          mickym Most Active @mickym last edited by mickym

          @mickym Warte hab den Fehler.

          payload.{"axisLabels": [_id~>/(Datum-(\d|10)$)/] ? val, "data" : [_id~>/(Verbrauch-(\d|10)$)/] ? val}
          

          Ich hab unten immer xaxisLabels geschrieben.

          D 1 Reply Last reply Reply Quote 0
          • D
            dos1973 @mickym last edited by

            @mickym
            es wird wärmer 😉
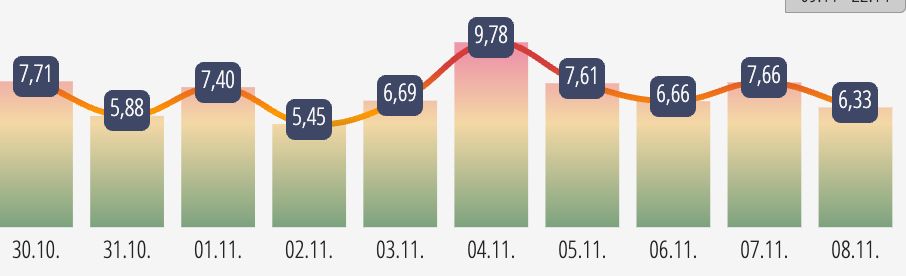
            es muss aber andersherum... und der 30.10/ 31.10 sind auch nicht in der richtigen reihenfolge.

            lässt sich das nicht hardcoden, dp-10, dp-9...

            Bildschirmfoto 2023-11-09 um 21.18.39.png

            mickym 1 Reply Last reply Reply Quote 0
            • mickym
              mickym Most Active @dos1973 last edited by

              @dos1973 Ich bin dran. 😉 Wie gesagt das Dumme ist dass Du -1 und -10 gemacht hast und damit wird es nach Zeichenketten sortiert und da kommt nun mal 1 und 10 vor 2.

              D 1 Reply Last reply Reply Quote 0
              • D
                dos1973 @mickym last edited by dos1973

                @mickym
                Ja, Anfänger Fehler

                Ich hätte -001, 002 Tage machen sollen, richtig?

                mickym 1 Reply Last reply Reply Quote 0
                • mickym
                  mickym Most Active @dos1973 last edited by

                  @dos1973 Eigentlich
                  -00, -01, etc. - aber ich wandle es nun in Zahlen um. Dauert halt bissi.

                  D 1 Reply Last reply Reply Quote 0
                  • D
                    dos1973 @mickym last edited by

                    @mickym

                    brauche ich wirklich ein Blockly mit cronjob,
                    dass meinen DP triggert, damit das nodeRed zb alle 10min läuft 🙂
                    suche noch ein 10min Trigger

                    mickym 1 Reply Last reply Reply Quote 0
                    • mickym
                      mickym Most Active @dos1973 last edited by

                      @dos1973 Einfach die Injectnode triggern lassen - da brauchst kein blockly

                      1 Reply Last reply Reply Quote 1
                      • mickym
                        mickym Most Active last edited by

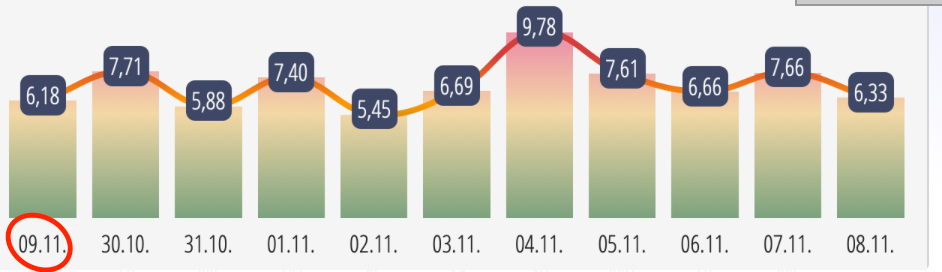
                        So damit sollte es nun gehen:

                        payload.{"axisLabels": [_id~>/(Datum-(\d|10)$)/] ? {"id": $number((_id~>/(\d|10)$/).match), "date":val}, 
                        "data" : [_id~>/(Verbrauch-(\d|10)$)/] ? {"id": $number((_id~>/(\d|10)$/).match), "val":val}}{"axisLabels":axisLabels,"data":data}
                        ~>|$|{"axisLabels":$sort(axisLabels,function($l,$r){$l.id > $r.id}),"data":$sort(data,function($l,$r){$l.id > $r.id})}|
                        ~>|$|{"axisLabels": axisLabels.date,"data":data.val}|
                        
                        D 1 Reply Last reply Reply Quote 0
                        • D
                          dos1973 @mickym last edited by dos1973

                          @mickym

                          fast 🙂

                          Bildschirmfoto 2023-11-09 um 22.10.37.png

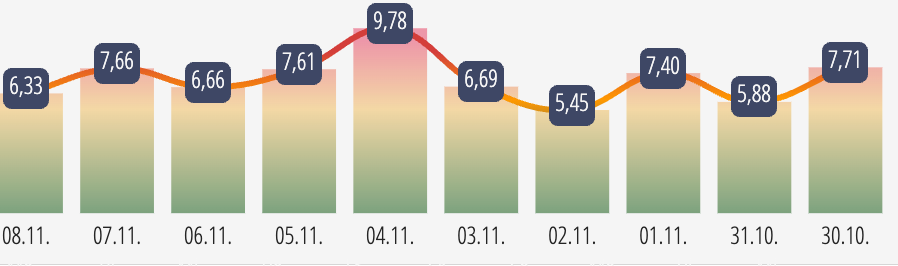
                          von links nach rechts aufsteigend.

                          manchmal kann ich ja code "interpretieren" aber hier sehe ich nur Bahnhof.

                          mickym 1 Reply Last reply Reply Quote 0
                          • mickym
                            mickym Most Active @dos1973 last edited by

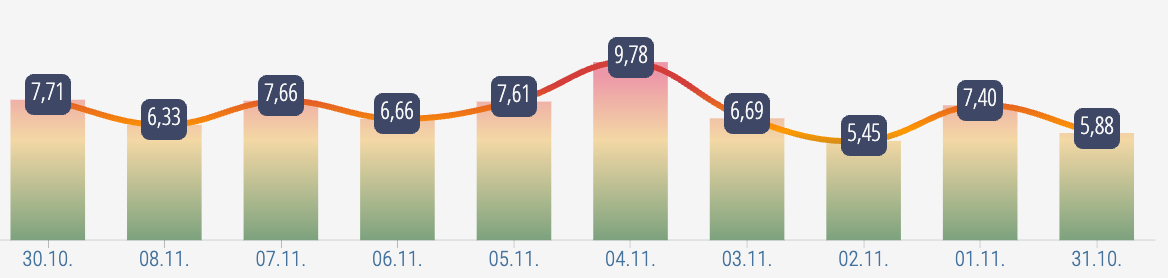
                            @dos1973 Dann dreh einfach mal das größer Zeichen um - keine Ahnung - warum das so ist.

                            payload.{"axisLabels": [_id~>/(Datum-(\d|10)$)/] ? {"id": $number((_id~>/(\d|10)$/).match), "date":val}, 
                            "data" : [_id~>/(Verbrauch-(\d|10)$)/] ? {"id": $number((_id~>/(\d|10)$/).match), "val":val}}{"axisLabels":axisLabels,"data":data}
                            ~>|$|{"axisLabels":$sort(axisLabels,function($l,$r){$l.id < $r.id}),"data":$sort(data,function($l,$r){$l.id < $r.id})}|
                            ~>|$|{"axisLabels": axisLabels.date,"data":data.val}|
                            
                            D 1 Reply Last reply Reply Quote 0
                            • D
                              dos1973 @mickym last edited by

                              @mickym welches?

                              mickym 1 Reply Last reply Reply Quote 0
                              • mickym
                                mickym Most Active @dos1973 last edited by mickym

                                @dos1973 Ich hab den Code nochmal gepostet

                                
                                payload.{"axisLabels": [_id~>/(Datum-(\d|10)$)/] ? {"id": $number((_id~>/(\d|10)$/).match), "date":val}, 
                                "data" : [_id~>/(Verbrauch-(\d|10)$)/] ? {"id": $number((_id~>/(\d|10)$/).match), "val":val}}{"axisLabels":axisLabels,"data":data}
                                ~>|$|{"axisLabels":$sort(axisLabels,function($l,$r){$l.id < $r.id}),"data":$sort(data,function($l,$r){$l.id < $r.id})}|
                                ~>|$|{"axisLabels": axisLabels.date,"data":data.val}|
                                
                                D 1 Reply Last reply Reply Quote 0
                                • D
                                  dos1973 @mickym last edited by

                                  @mickym

                                  YES!!!
                                  Bildschirmfoto 2023-11-09 um 22.15.00.png

                                  nur noch der aktuelle Tag.

                                  mickym 1 Reply Last reply Reply Quote 0
                                  • mickym
                                    mickym Most Active @dos1973 last edited by mickym

                                    @dos1973 Ok dann sag nochmal woher Du den holst und wie sieht der vom value her aus.

                                    sourceanalytix.0.0_userdata__0__mqtt__shellies__Pro3_EM__events__rpc__params__em:0__total_act_power.currentYear.consumed.01_currentDay
                                    

                                    Bzw. muss ich eigentlich nicht wissen - Du holst einfach einen Zahlenwert irgendwoher?

                                    D 1 Reply Last reply Reply Quote 0
                                    • D
                                      dos1973 @mickym last edited by

                                      @mickym

                                      sourceanalytix.0.0_userdata__0__mqtt__shellies__Pro3_EM__events__rpc__params__em:0__total_act_power.currentYear.consumed.01_currentDay


                                      einfach der heutige Verbrauch als Inhalt.

                                      5,922
                                      
                                      1 Reply Last reply Reply Quote 0
                                      • mickym
                                        mickym Most Active last edited by mickym

                                        Ok bin fertig:

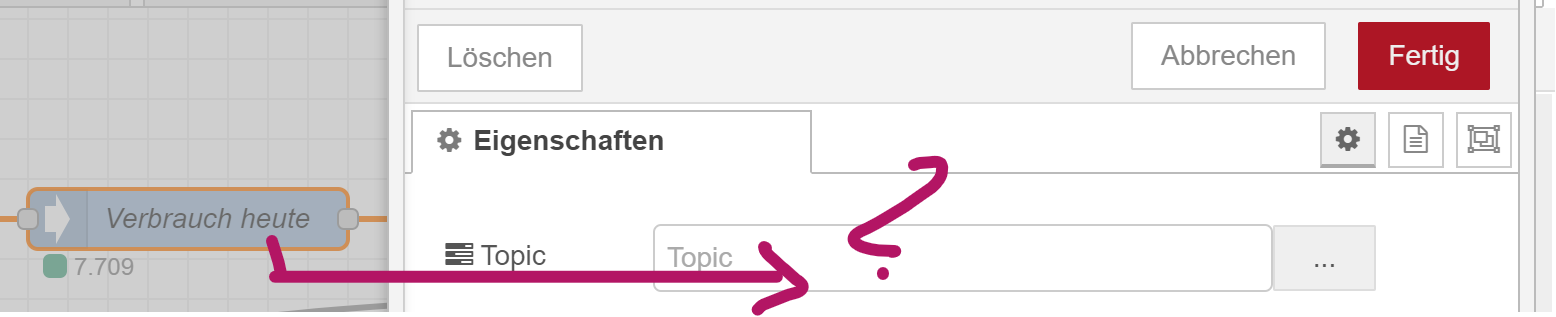
                                        Einfach diese 3 Nodes noch einfügen.

                                        9c2e60c2-49e5-48fa-8b9c-c6284f281956-image.png

                                        [
                                           {
                                               "id": "bd6eca790986a04a",
                                               "type": "change",
                                               "z": "5a7d3179c5870381",
                                               "name": "",
                                               "rules": [
                                                   {
                                                       "t": "set",
                                                       "p": "date",
                                                       "pt": "msg",
                                                       "to": "$moment().format(\"DD.MM.\")",
                                                       "tot": "jsonata"
                                                   }
                                               ],
                                               "action": "",
                                               "property": "",
                                               "from": "",
                                               "to": "",
                                               "reg": false,
                                               "x": 920,
                                               "y": 640,
                                               "wires": [
                                                   [
                                                       "247b31bbef072b30"
                                                   ]
                                               ]
                                           },
                                           {
                                               "id": "a507d81536b10e6d",
                                               "type": "change",
                                               "z": "5a7d3179c5870381",
                                               "name": "Ergänze Graph",
                                               "rules": [
                                                   {
                                                       "t": "set",
                                                       "p": "payload",
                                                       "pt": "msg",
                                                       "to": "$.payload~>|$|{\"axisLabels\":$append($$.date,axisLabels)}| ~>|$.graphs|{\"data\":$append($$.val_today,data)}|",
                                                       "tot": "jsonata"
                                                   }
                                               ],
                                               "action": "",
                                               "property": "",
                                               "from": "",
                                               "to": "",
                                               "reg": false,
                                               "x": 1320,
                                               "y": 640,
                                               "wires": [
                                                   [
                                                       "f1e2f69ae8e15d75",
                                                       "2de45b53a28dc5d2"
                                                   ]
                                               ]
                                           },
                                           {
                                               "id": "247b31bbef072b30",
                                               "type": "ioBroker get",
                                               "z": "5a7d3179c5870381",
                                               "name": "Verbrauch heute",
                                               "topic": "0_userdata.0.Test.dos-1973.-2_Tage.Verbrauch-2",
                                               "attrname": "val_today",
                                               "payloadType": "value",
                                               "errOnInvalidState": "nothing",
                                               "x": 1120,
                                               "y": 640,
                                               "wires": [
                                                   [
                                                       "a507d81536b10e6d"
                                                   ]
                                               ]
                                           }
                                        ]
                                        

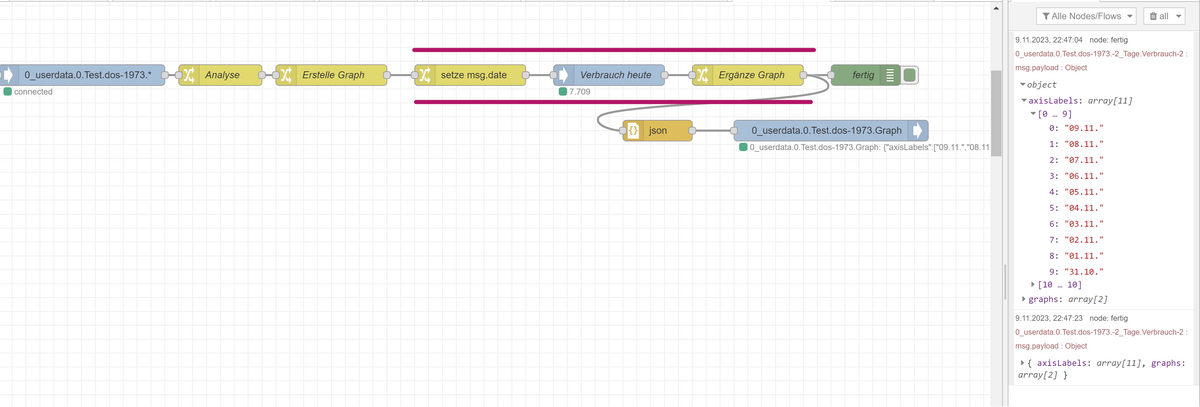
                                        In der get-Node "Verbrauch heute" halt noch den richtigen Pfad zum Datenpunkt einfügen.

                                        0ee585d4-a6a8-44d7-aac7-65a14bbe38fe-image.png

                                        Und zum Schluß kann ich immer nur wieder sagen, lernt JSONATA mit diesem Tool - so erstelle ich ja meine Ausdrücke auch, in dem ich diese Stück für Stück zusammensetze. Hier kannst Du ausprobieren, welche Teile welche Auswirkungen haben: https://try.jsonata.org/Dcmx04fzH

                                        D 1 Reply Last reply Reply Quote 0
                                        • D
                                          dos1973 @mickym last edited by

                                          @mickym

                                          soweit stimmt es, nur steht der Wert an falscher stelle

                                          Bildschirmfoto 2023-11-09 um 22.59.33.png

                                          1 Reply Last reply Reply Quote 0
                                          • mickym
                                            mickym Most Active last edited by mickym

                                            Ok - verstehe zwar wieder nicht warum aber dann tausch einfach in der letzten Change Node (Ergänze Graph) die beiden Parameter in der append Funktion.

                                            $.payload~>|$|{"axisLabels":$append(axisLabels,$$.date)}|
                                            ~>|$.graphs|{"data":$append(data,$$.val_today)}|
                                            

                                            Also in der letzten Node.

                                            1 Reply Last reply Reply Quote 0
                                            • First post
                                              Last post

                                            Support us

                                            ioBroker
                                            Community Adapters
                                            Donate

                                            911
                                            Online

                                            32.0k
                                            Users

                                            80.4k
                                            Topics

                                            1.3m
                                            Posts

                                            2
                                            80
                                            3184
                                            Loading More Posts
                                            • Oldest to Newest
                                            • Newest to Oldest
                                            • Most Votes
                                            Reply
                                            • Reply as topic
                                            Log in to reply
                                            Community
                                            Impressum | Datenschutz-Bestimmungen | Nutzungsbedingungen
                                            The ioBroker Community 2014-2023
                                            logo