Navigation

    Logo
    • Register
    • Login
    • Search
    • Recent
    • Tags
    • Unread
    • Categories
    • Unreplied
    • Popular
    • GitHub
    • Docu
    • Hilfe
    1. Home
    2. Deutsch
    3. Visualisierung
    4. Jarvis 3.1.8 - zukünftige Strompreise - Skalierung, Farben

    NEWS

    • ioBroker@Smart Living Forum Solingen, 14.06. - Agenda added

    • ioBroker goes Matter ... Matter Adapter in Stable

    • Monatsrückblick - April 2025

    Jarvis 3.1.8 - zukünftige Strompreise - Skalierung, Farben

    This topic has been deleted. Only users with topic management privileges can see it.
    • M
      MCU @icebear last edited by

      @icebear Versuch es mal hiermit:
      https://mcuiobroker.gitbook.io/jarvis-infos/jarvis-v3/besonderheiten-v3/styles/statelist-1/statelist-horizontal#icons-in-statelist-horizontal-vergroessern

      https://mcuiobroker.gitbook.io/jarvis-infos/jarvis-v3/besonderheiten-v3/styles/statelist-1/statelist-horizontal#statelist-element-bzw-items-naeher-zusammen-fuehren

      icebear 1 Reply Last reply Reply Quote 0
      • icebear
        icebear @MCU last edited by icebear

        @mcu said in Jarvis 3.1.8 - zukünftige Strompreise - Skalierung, Farben:

        Versuch es mal hiermit:

        Guten Morgen, hat bedingt funktioniert.

        margin.png

        also das näher zusammenrücken hat mit 'padding:0px' nicht funktioniert, aber wenn ich es auf margin ändere dann geht es.

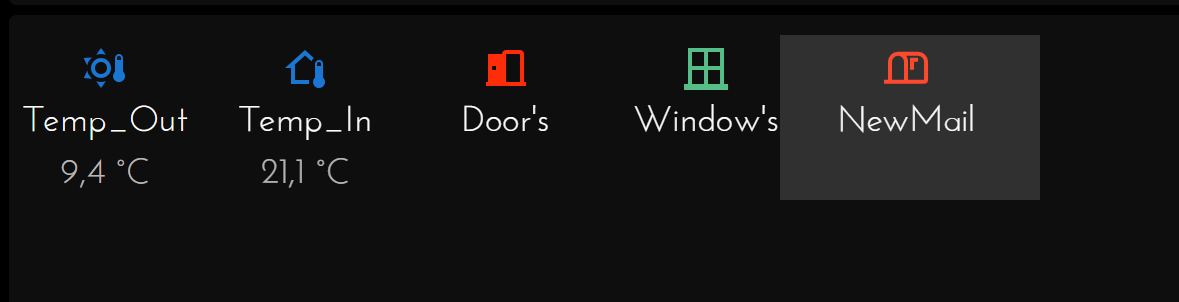
        .jarvis-widget-d030c3e7-3b92-48fe-812a-39dc62786c63 .jarvis-StateList.horizontal .jarvis-StateListItem {
        	margin: -15px !important;
        }
        

        Und das vergrößern der Icon's, da tut sich garnix --> EDIT: 08:08Uhr

        du hast bei dem Icon in der CSS-Anweisung ein '-' bei fontsize vergessen.

        so gehts:

        .jarvis-widget-5c00f31a-7f5e-477a-b43d-e5f2b5a10378 .jarvis-StateListItem-Icon svg{
                font-size: 40px;
        }
        

        horizon.png

        Danke für den richtigen Weg

        1 Reply Last reply Reply Quote 0
        • M
          Mike42 @MCU last edited by

          @mcu das ist eine gute Lösung für die Linien

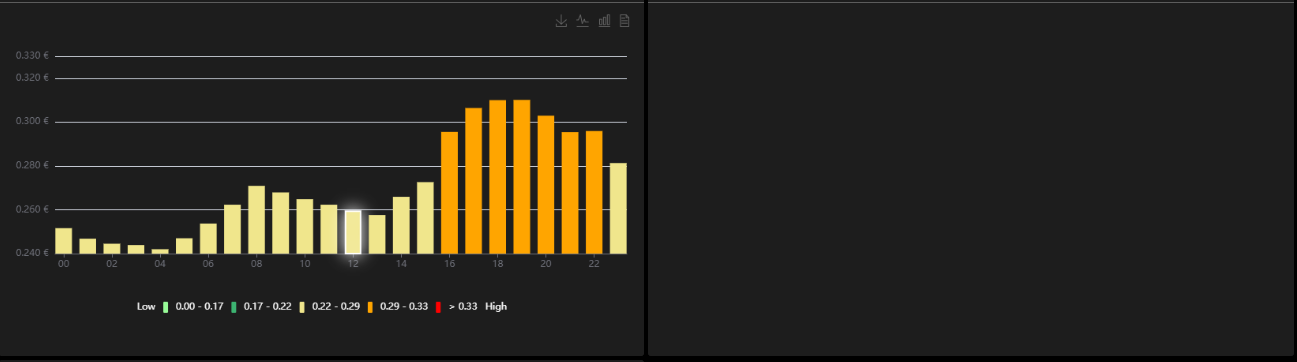
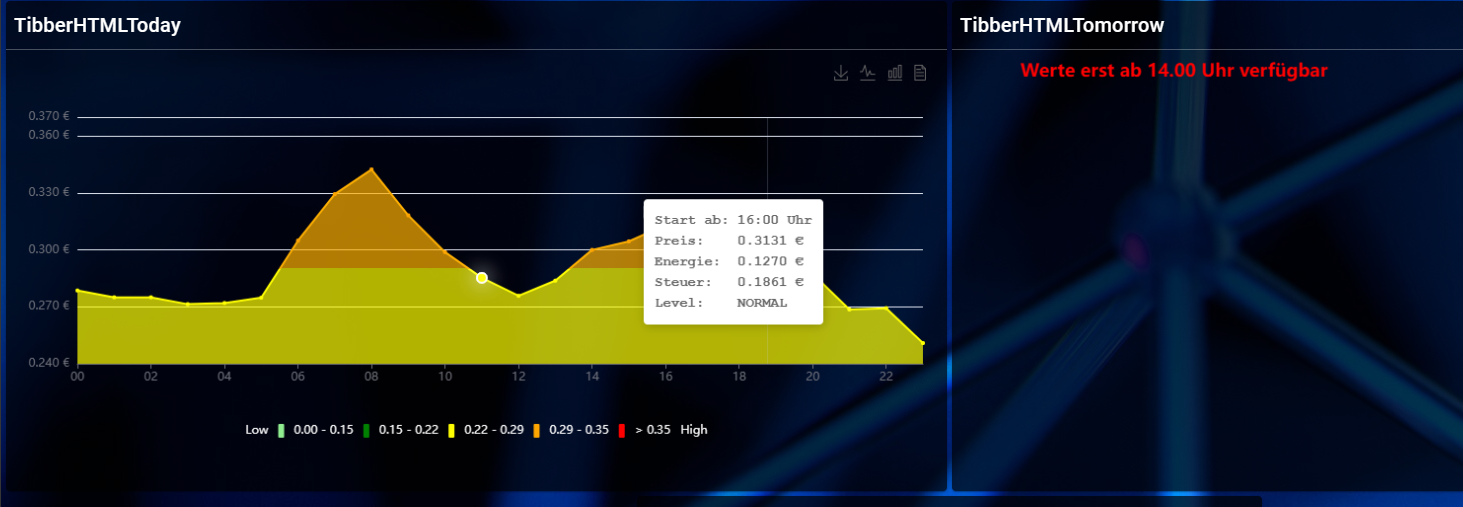
          Heute morgen sieht es bei mir so aus:

          IMG_2753.jpeg

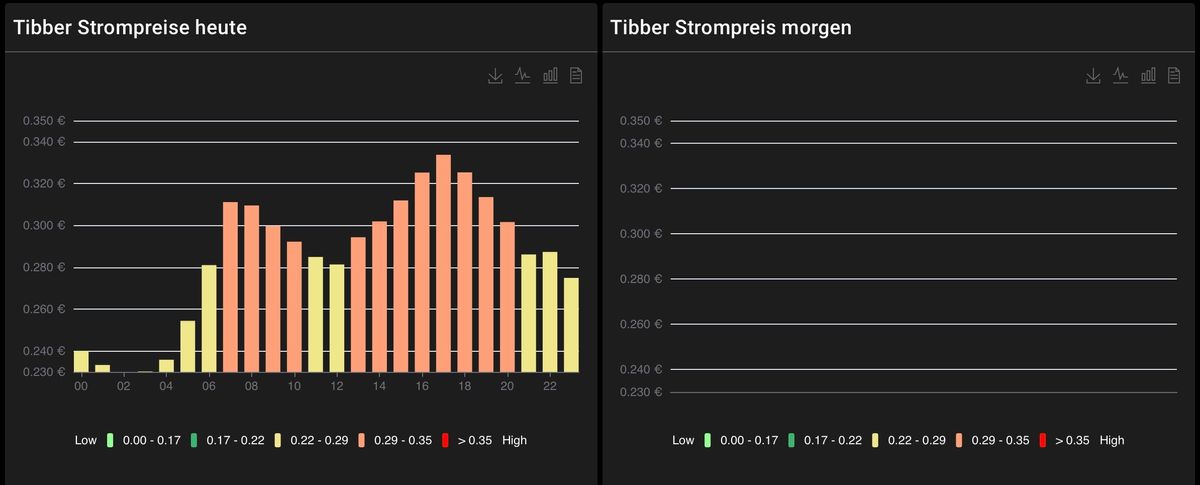
          Today skaliert bei den niedrigen Preisen etwas komisch, wahrscheinlich weil es nichts abzurunden gibt…. Vlt nach dem abrunden nochmal 0.01 abziehen?

          Tomorrow zeigt nun ein leeres Grid, aber kein „wait“ Label (ist eingeschaltet)

          icebear M 2 Replies Last reply Reply Quote 0
          • icebear
            icebear @Mike42 last edited by

            @mike42 said in Jarvis 3.1.8 - zukünftige Strompreise - Skalierung, Farben:

            Tomorrow zeigt nun ein leeres Grid, aber kein „wait“ Label (ist eingeschaltet)

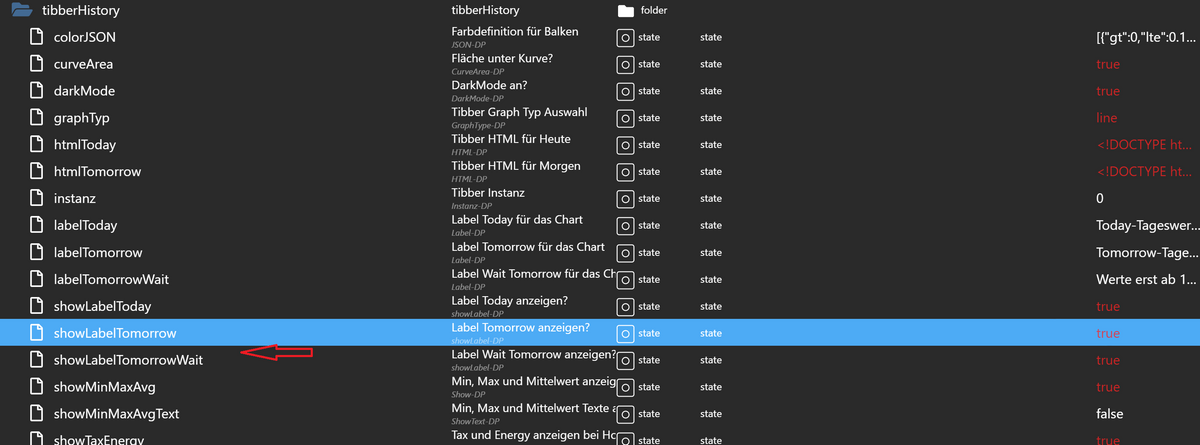
            mußt du hier einschalten

            wait.png

            1 Reply Last reply Reply Quote 0
            • M
              MCU @Mike42 last edited by MCU

              @mike42 Bei mir ist es drin ?
              c9ceab9e-3373-4740-94d3-b60d983a8f2d-image.png

              Probier mal -> Doku v1.0.17

              M 1 Reply Last reply Reply Quote 0
              • M
                Mike42 @MCU last edited by

                @mcu jetzt sind schon wieder Werte da.... schaue morgen früh

                M 1 Reply Last reply Reply Quote 0
                • M
                  MCU @Mike42 last edited by

                  @mike42 Zeig mal Deine Objekte

                  M 1 Reply Last reply Reply Quote 0
                  • M
                    Mike42 @MCU last edited by

                    @mcu 0_userdata.0.tibberHistory.json

                    M 1 Reply Last reply Reply Quote 0
                    • M
                      MCU @Mike42 last edited by MCU

                      @mike42 Nee war noch ein Problem im Prgramm, mache Update fertig.
                      Doku v1.0.18

                      M 1 Reply Last reply Reply Quote 0
                      • M
                        Mike42 @MCU last edited by Mike42

                        @mcu eingebaut.... bin morgen früh gespannt 🙂

                        Gerade gesehen: "Label tomorrow" wird angezeigt obwohl "show label tomorrow" auf false steht

                        M 1 Reply Last reply Reply Quote 0
                        • M
                          MCU @Mike42 last edited by MCU

                          @mike42 Schau ich mir nachher an. Hab da schon eine Vermutung.
                          Doku -> v1.0.19

                          1 Reply Last reply Reply Quote 0
                          • M
                            Mike42 last edited by Mike42

                            @mcu ja, ist wieder weg

                            Update: alles prima heute morgen, “wait” Label ist sichtbar…. kann man so lange das Label sichtbar ist, das Grid verschwinden lassen?

                            M 1 Reply Last reply Reply Quote 0
                            • M
                              MCU @Mike42 last edited by

                              @mike42 Doku -> v1.0.20

                              M 1 Reply Last reply Reply Quote 0
                              • M
                                Mike42 @MCU last edited by

                                @mcu jetzt ist das Grid weg, aber auch das Wait-Label

                                M 1 Reply Last reply Reply Quote 0
                                • M
                                  MCU @Mike42 last edited by MCU

                                  @mike42
                                  878b5a92-f934-4fc0-9b02-275df49f3f52-image.png
                                  Dann bitte die Werte von Today und Tomorrow.
                                  Einstellungen korrekt?

                                  M 1 Reply Last reply Reply Quote 0
                                  • M
                                    Mike42 @MCU last edited by

                                    @mcu today und tomorrow sind beide false

                                    M 1 Reply Last reply Reply Quote 0
                                    • M
                                      MCU @Mike42 last edited by MCU

                                      @mike42
                                      1fab80e5-36ae-40c8-a0b3-27c38ced2b02-image.png
                                      Ich wollte die Daten von PricesToday und PricesTomorow., um zu schauen, ob es da Änderungen gibt.

                                      M 1 Reply Last reply Reply Quote 0
                                      • M
                                        Mike42 @MCU last edited by

                                        @mcu 0_userdata.0.tibberHistory.json tibberlink.0.Homes.xyz.PricesTomorrow.json tibberlink.0.Homes.xyz.PricesToday.json

                                        Unbenannt2.PNG

                                        M 1 Reply Last reply Reply Quote 0
                                        • M
                                          MCU @Mike42 last edited by MCU

                                          @mike42 Problem entdeckt, weiß nur noch nicht wo es her kommt. Du bekommst in F12 Log einen Fehler angezeigt?

                                          Zeige mal vom Programm die Zeilen 360 - 370
                                          5d4a0753-4163-47a0-83ea-23dbf061857f-image.png
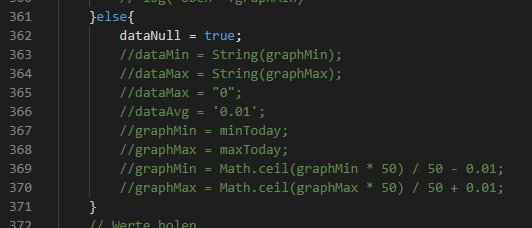
                                          Kann es sein, dass be Dir noch dataMax = "0" drin ist?

                                          M 1 Reply Last reply Reply Quote 0
                                          • M
                                            Mike42 @MCU last edited by

                                            @mcu

                                            }else{
                                            dataNull = true;
                                            //dataMin = String(graphMin);
                                            //dataMax = String(graphMax);
                                            //dataMax = "0";
                                            //dataAvg = '0.01';
                                            //graphMin = minToday;
                                            //graphMax = maxToday;
                                            //graphMin = Math.ceil(graphMin * 50) / 50 - 0.01;
                                            //graphMax = Math.ceil(graphMax * 50) / 50 + 0.01;
                                            }

                                            M 1 Reply Last reply Reply Quote 0
                                            • First post
                                              Last post

                                            Support us

                                            ioBroker
                                            Community Adapters
                                            Donate

                                            699
                                            Online

                                            31.7k
                                            Users

                                            79.8k
                                            Topics

                                            1.3m
                                            Posts

                                            11
                                            311
                                            30671
                                            Loading More Posts
                                            • Oldest to Newest
                                            • Newest to Oldest
                                            • Most Votes
                                            Reply
                                            • Reply as topic
                                            Log in to reply
                                            Community
                                            Impressum | Datenschutz-Bestimmungen | Nutzungsbedingungen
                                            The ioBroker Community 2014-2023
                                            logo