Fehler Backitup Grafana
-
@minkhx So. Ich bin jetzt ein Stück weiter, d.h. es gibt neue IOBs-Botschaften bzw. Fehlermeldungen:)
Es sieht aber schon ganz gut aus, finde ich.
Grafana mit dem 2-Zeiler von Thomas von Enterprise auf OSS 12.0.0 geswitched (So ein ordentlicher Linux-Unterbau ist schon was wert).
Ich habe den alten backitup-Adapter einfach gelöscht.
Die Repos irgendwo von stable auf beta umgestellt und mit der Skimaske das Github-Icon freigeschaltet.
Dann dort backi eingegeben -> backitup[simatec] ausgewählt.
Jetzt habe ich 3.2.2, npm 10.8 und diesen output, beim Versuch von Grafana ein bckup anzulegen:
19:51:18.933
DEBUG
grafana
Start Grafana Backup ...
19:51:18.935
DEBUG
grafana
Created grafana_tmp directory: "/opt/iobroker/backups/grafana_tmp"
19:51:18.948
DEBUG
grafana
Created dashboard directory
19:51:18.954
DEBUG
grafana
Created folder directory
19:51:18.956
DEBUG
grafana
Created dashboards_manually_restore directory
19:51:18.959
DEBUG
grafana
Created datasource directory
19:51:18.993
DEBUG
grafana
start Grafana request ...
19:51:19.042
DEBUG
grafana
Grafana is available ... Status: 200
19:51:19.271
ERROR
grafana
Error on Grafana Dashboard Request: AxiosError: Request failed with status code 401
19:51:19.283
DEBUG
grafana
Saved dashboard-folder mapping
19:51:19.294
ERROR
grafana
Error on Grafana-Folder: AxiosError: Request failed with status code 401
19:51:19.299
DEBUG
grafana
start Grafana backup compress ...
19:51:19.314
DEBUG
grafana
Try deleting the Grafana tmp directory: "/opt/iobroker/backups/grafana_tmp"
19:51:19.343
DEBUG
grafana
Grafana tmp directory "/opt/iobroker/backups/grafana_tmp" successfully deleted
19:51:19.383
DEBUG
grafana
doneSo ein 401er kann doch jetzt nicht so dramatisch sein, oder?
Ich nutze den Original admin-acc samt pwd aus der Ersteinrichtung, was seltsamerweise auch nach dem switch noch funktioniert und den API-Key, welcher bei der Ersti gewonnen wurde.
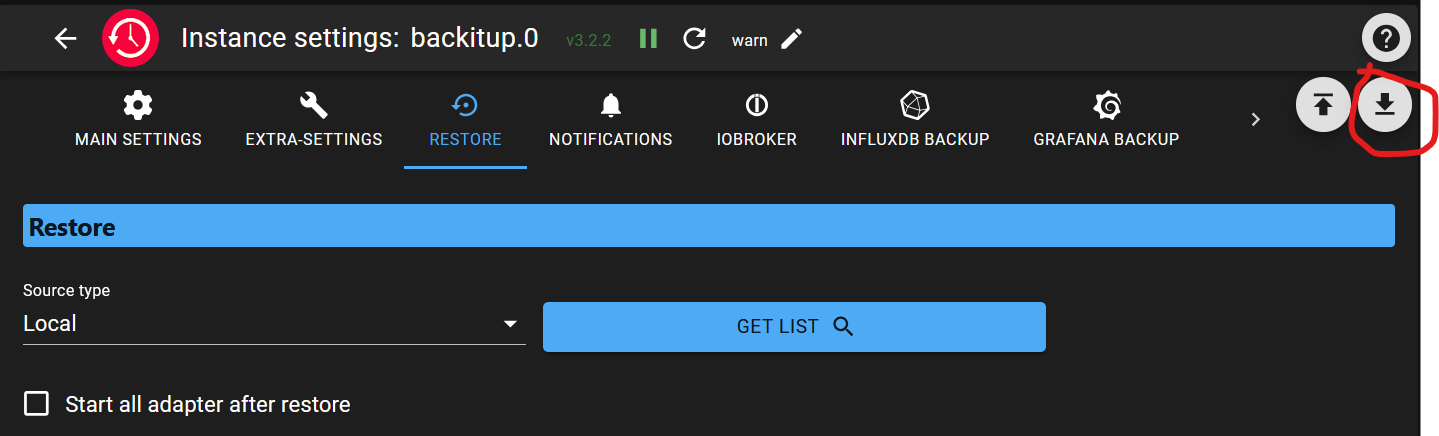
Im backitup Grafana-Reiter steht ja:
"Grafana API-Schlüssel oder Service Token".
Und API-Schlüssel ist doch der API-Key aus der Ersti, oder?
Falls jemand ähnliches Interesse an der beta verfolgt, kann er sich ja melden.
Danke. -
@minkhx said in Fehler Backitup Grafana:
Error on Grafana-Folder: AxiosError: Request failed with status code 401
Ok, der 401er ist was mit Zugangsrechten.
Wenn man in Grafana einen Service-acc anlegt (hier name: backup, rights: admin), einen frischen Token zapft und diesen dann im Grafana-Reiter im backitup einträgt zusammen mit dem admin-Zugang läuft es.
Falls jemand eine Zusammenfassung benötigt, um nicht am Selbigen zu verzweifeln, kann ich das nochmal zusammen schreiben.
Danke Thomas und simatec. You did the trick. -
@minkhx steht doch aber alles in der Doku
-
@simatec Das tut es bestimmt, allerdings ist es für einen Einsteiger nicht so eindeutig. ZB "API-Schlüssel bzw. Service Token" und das der Service-acc bestimmte Nutzerrechte braucht, was ich nur hier im Chatverlauf nachvollziehen konnte, da hab ich mich mit der Rumprobierei etwas verzettelt.
Der Hinweis auf die Beta wäre vllt. noch etwas für die Doku. Ist bestimmt schon woanders dokumentiert, aber ich hab da noch keinen roten Faden.
Dafür aber auch ein paar neue Linux-Befehle gelernt;) Und wie man seine fehlermeldungen am besten beschreibt. Z.B. mit dem log-ouput.
Aprospos, was bedeutet dies:
22:10:09.960
DEBUG
grafana
Start Grafana Backup ...
22:10:09.964
DEBUG
grafana
Created grafana_tmp directory: "/opt/iobroker/backups/grafana_tmp"
22:10:09.980
DEBUG
grafana
Created folder directory
22:10:09.982
DEBUG
grafana
Created dashboards_manually_restore directory
22:10:10.017
DEBUG
grafana
Created datasource directory
22:10:10.029
DEBUG
grafana
start Grafana request ...
22:10:10.075
DEBUG
grafana
Grafana is available ... Status: 200
22:10:10.650
DEBUG
grafana
Saved dashboard-folder mapping
22:10:10.833
DEBUG
grafana
start Grafana backup compress ...
22:10:10.851
DEBUG
grafana
Try deleting the Grafana tmp directory: "/opt/iobroker/backups/grafana_tmp"
22:10:10.864
ERROR
grafana
cannot found Grafana Backup files
22:10:10.900
DEBUG
grafana
doneLiegt das an der manuellen Vorgehensweise, das Backup zu machen?
Eine Datei gibt es? /files/backitup.admin/grafana.jsonConfig.json5 mit 5 kB -
@minkhx Habs grad im Forum gesehen, so ist besser, oder?
Z42-44 sieht komisch aus:23:50:49.636 DEBUG grafana Created dashboard directory 23:50:49.651 DEBUG grafana Created folder directory 23:50:49.671 DEBUG grafana Created dashboards_manually_restore directory 23:50:49.681 DEBUG grafana Created datasource directory 23:50:49.684 DEBUG grafana start Grafana request ... 23:50:49.752 DEBUG grafana Grafana is available ... Status: 200 23:50:50.202 DEBUG grafana Saved dashboard-folder mapping 23:50:50.273 DEBUG grafana start Grafana backup compress ... 23:50:50.281 DEBUG grafana Try deleting the Grafana tmp directory: "/opt/iobroker/backups/grafana_tmp" 23:50:50.312 DEBUG grafana Grafana tmp directory "/opt/iobroker/backups/grafana_tmp" successfully deleted 23:50:50.346 ERROR grafana cannot found Grafana Backup files 23:50:50.348 DEBUG grafana done 23:50:51.068 DEBUG nodered Created nodered tmp directory 23:50:51.149 DEBUG nodered Node-Red tmp copy finish 23:50:51.215 DEBUG nodered Backup created: /opt/iobroker/backups/nodered.0_2025_05_22-23_50_52_backupiobroker.tar.gz 23:50:51.256 DEBUG nodered node-red tmp directory "/opt/iobroker/backups/noderedtmp0" successfully deleted 23:50:51.271 DEBUG nodered done 23:50:52.441 WARN clean No older backup files are deleted, because this backup was started manually -
@minkhx Dein Backup wird nicht korrekt erzeugt.
Zeige bitte deine Config von Backitup als json File.
Hast du den API Token / Service-Token mit Admin Rechten erzeugt? Hat der Token eine Gültigkeit? -
@simatec
Da wo die anderen json5-Dateien liegen, finde ich nichts mit Namen backitup. Nur eine .png und .svg? Weiß nicht, wo ich die Datei herkriegen soll. Über Putty?
Serv-cc mit Token (straight nach Doku:)
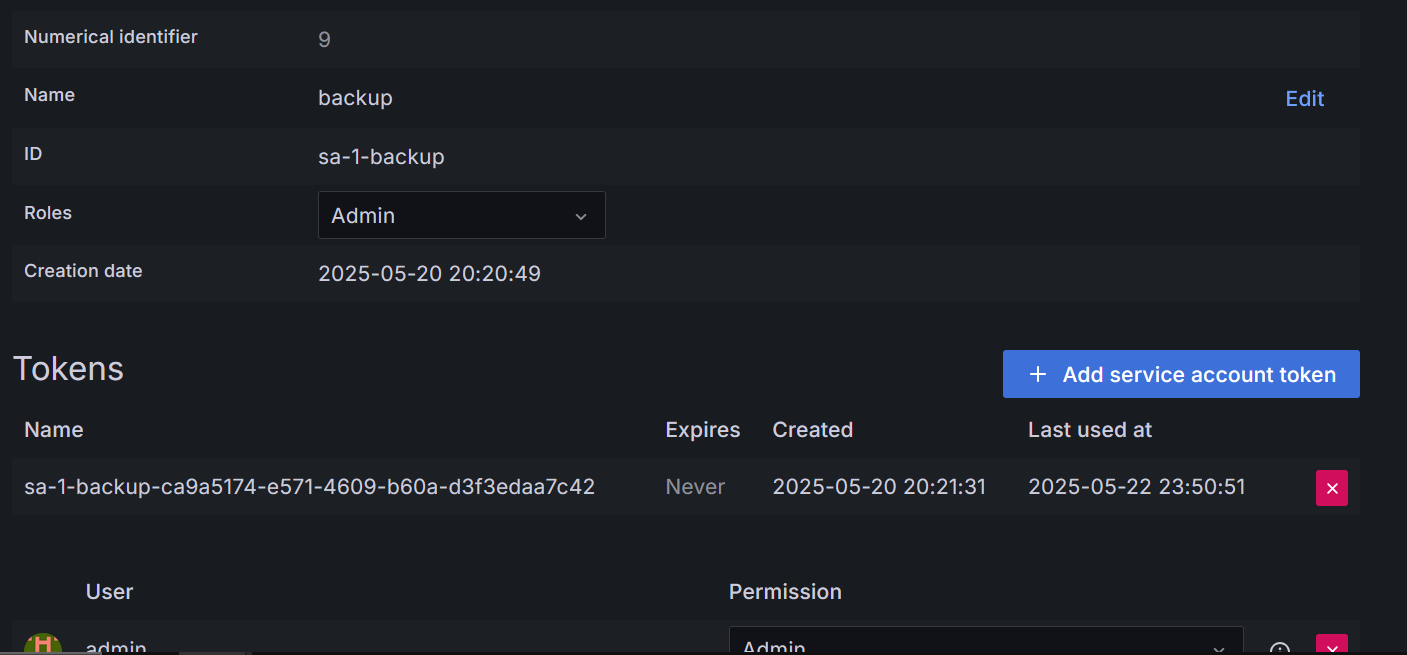
-
-
@marc-berg Ahh:)
{ "advancedDelete": false, "cacheLoose": false, "ccuCron": false, "ccuCronJob": "00 36 01 */3 * *", "ccuDeleteAfter": 10, "ccuEnabled": false, "ccuEvents": [], "ccuEveryXDays": 3, "ccuHost": "", "ccuMulti": false, "ccuNameSuffix": "", "ccuPassword": "", "ccuSignedCertificates": true, "ccuTime": "01:36", "ccuUsehttps": false, "ccuUser": "Admin", "cifsCcuDir": "sharename/backupDir", "cifsDeleteOldBackup": false, "cifsDir": "sharename/backupDir", "cifsDomain": "", "cifsEnabled": false, "cifsMinimalDir": "sharename/backupDir", "cifsMount": "", "cifsOwnDir": false, "cifsUser": "", "connectType": "NFS", "debugLevel": false, "deleteOldDataBase": false, "discordInstance": "discord.0", "discordNoticeType": "longDiscordNotice", "discordOnlyError": false, "discordTarget": "", "discordWaitToSend": 0, "dropboxAccessJson": "", "dropboxAccessToken": "", "dropboxCcuDir": "/backupDir/ccu", "dropboxCodeChallenge": "", "dropboxDeleteAfter": 10, "dropboxDeleteOldBackup": false, "dropboxDir": "/backupDir", "dropboxEnabled": false, "dropboxMinimalDir": "/backupDir/iobroker", "dropboxOwnDir": false, "dropboxTokenType": "custom", "emailInstance": "email.0", "emailNoticeType": "longEmailNotice", "emailOnlyError": false, "emailReceiver": "xxx@xxx.com", "emailSender": "xxx@xxx.com", "emailWaitToSend": 0, "esphomeEnabled": false, "expertMount": "sudo mount -t cifs -o username=<username>,password=\"<password>\",noserverino,cache=loose,rw,forceuid,uid=iobroker,forcegid,gid=iobroker,file_mode=0777,dir_mode=0777,vers=3.1.1 //192.168.0.1/NAS/BACKUP /opt/iobroker/backups", "fileSizeError": 512, "fileSizeWarning": 1024, "ftpCcuDir": "/backupDir/ccu", "ftpDeleteAfter": 10, "ftpDeleteOldBackup": false, "ftpDir": "/backupDir", "ftpEnabled": false, "ftpHost": "", "ftpMinimalDir": "/backupDir/iobroker", "ftpOwnDir": false, "ftpPassword": "", "ftpPort": 21, "ftpSecure": false, "ftpSignedCertificates": true, "ftpUser": "", "googledriveAccessTokens": "", "googledriveCcuDir": "/backupDir/ccu", "googledriveDeleteAfter": 10, "googledriveDeleteOldBackup": false, "googledriveDir": "/backupDir", "googledriveEnabled": false, "googledriveMinimalDir": "/backupDir/iobroker", "googledriveOwnDir": false, "gotifyInstance": "gotify.0", "gotifyNoticeType": "longGotifyNotice", "gotifyOnlyError": false, "gotifyWaitToSend": 0, "grafanaApiKey": "glsa_cnSQbtiq9K7eTerEvm3Z9Cm4YiOZRcVX_249c5ccc", "grafanaEnabled": true, "grafanaHost": "flowbox", "grafanaPassword": "xxx", "grafanaPort": "3000", "grafanaProtocol": "http", "grafanaSignedCertificates": true, "grafanaUsername": "admin", "historyEnabled": false, "historyEntriesNumber": 25, "historyPath": "/opt/iobroker/iobroker-data/history", "hostType": "Single", "ignoreErrors": false, "influxDBDeleteAfter": 5, "influxDBDumpExe": "", "influxDBEnabled": true, "influxDBEvents": [], "influxDBHost": "localhost", "influxDBMulti": false, "influxDBName": "buck", "influxDBPort": 8086, "influxDBProtocol": "http", "influxDBToken": "19JaEjvfdfgXb7pYrYD3pVrmPdtESYwcD7BmltjxNzloFiZPAMNESU93Hy9op8u_IY52Dfyt2yIHSdGgwRhkSw==", "influxDBType": "local", "influxDBVersion": "2.x", "iobrokerCron": false, "iobrokerCronJob": "00 48 02 */1 * *", "jarvisEnabled": false, "javascriptsEnabled": false, "macAd": "20:DE:20:DE:20:DE", "matrixInstance": "matrix-org.0", "matrixNoticeType": "longMatrixNotice", "matrixOnlyError": false, "matrixWaitToSend": 0, "minimalDeleteAfter": 20, "minimalEnabled": true, "minimalEveryXDays": 5, "minimalNameSuffix": "", "minimalTime": "02:48", "mySqlDeleteAfter": 5, "mySqlDumpExe": "", "mySqlEnabled": false, "mySqlEvents": [], "mySqlHost": "localhost", "mysqlMinimalEnabled": false, "mySqlMulti": false, "mySqlName": "iobroker", "mySqlPassword": "", "mySqlPort": "3306", "mysqlQuick": false, "mysqlSingleTransaction": false, "mySqlUser": "", "noderedEnabled": true, "noserverino": false, "notificationEnabled": false, "notificationsType": "Telegram", "onedriveAccessJson": "", "onedriveCcuDir": "backupDir/ccu", "onedriveDeleteAfter": 10, "onedriveDeleteOldBackup": false, "onedriveDir": "backupDir", "onedriveEnabled": false, "onedriveLastTokenRenew": "", "onedriveMinimalDir": "backupDir/iobroker", "onedriveOwnDir": false, "pgSqlDeleteAfter": 5, "pgSqlDumpExe": "", "pgSqlEnabled": false, "pgSqlEvents": [], "pgSqlHost": "", "pgSqlMulti": false, "pgSqlName": "", "pgSqlPassword": "", "pgSqlPort": "5432", "pgSqlUser": "", "pushoverDeviceID": "", "pushoverInstance": "pushover.0", "pushoverNoticeType": "longPushoverNotice", "pushoverOnlyError": false, "pushoverSilentNotice": false, "pushoverWaitToSend": 0, "redisAOFactive": false, "redisEnabled": false, "redisHost": "", "redisMinimalEnabled": false, "redisPassword": "", "redisPath": "/var/lib/redis", "redisPort": 6379, "redisType": "local", "redisUser": "default", "restoreSource": "local", "restoreTab": false, "signalInstance": "signal-cmb.0", "signalNoticeType": "longSignalNotice", "signalOnlyError": false, "signalWaitToSend": 0, "slaveInstance": "backitup.1", "slaveNameSuffix": "", "smbType": "vers=3.1.1", "sqliteDumpExe": "", "sqliteEnabled": false, "sqlitePath": "/opt/sqlite/data.db", "startAllRestore": false, "stopSlaveAfter": false, "sudoMount": true, "telegramInstance": "telegram.0", "telegramNoticeType": "longTelegramNotice", "telegramOnlyError": false, "telegramSilentNotice": false, "telegramUser": "allTelegramUsers", "telegramWaitToSend": 0, "wakeOnLAN": false, "webdavCcuDir": "/backupDir/ccu", "webdavDeleteAfter": 10, "webdavDeleteOldBackup": false, "webdavDir": "/backupDir", "webdavEnabled": false, "webdavMinimalDir": "/backupDir/iobroker", "webdavOwnDir": false, "webdavPassword": "", "webdavSignedCertificates": true, "webdavURL": "https://<example.com>/remote.php/dav/files/<username>/", "webdavUsername": "username", "whatsappInstance": "whatsapp-cmb.0", "whatsappNoticeType": "longWhatsappNotice", "whatsappOnlyError": false, "whatsappWaitToSend": 0, "wolExtra": false, "wolPort": 9, "wolWait": 25, "yahkaEnabled": false, "zigbee2mqttEnabled": false, "zigbee2mqttPath": "/opt/zigbee2mqtt/data", "zigbeeEnabled": false, "_nonSupportDockerDB": false } -
@minkhx history enabled auf true setzen?
-
@minkhx Wenn du den History Adapter nutzt und diese Daten sichern willst ja.
-
@minkhx Nimm mal als Grafana Host die IP und nicht den DNS
-
@simatec Selbe Stelle, gleiche Welle. Also ich hab das in der GUI von backitup eingestellt, nicht in der json direkt (trau ich mir nicht)
EDIT: Die IP wurde in die json aber übernommen, habe grad nachgesehen.
Service-acc nochmal neu?EDIT2: Zwischenmeldung
Ich hab nur ioB angehakt. Backup läuft.
Dann zus. Grafana checkboxed. Backup läuft.
So war das vorher auch, und ich vergaß zu erwähnen, srry.
Als ich dann influx anhakte kam der Fehler.
Im jetzigen Durchlauf aber nicht, 1. ioB dann Grafana, dann influx.
Ich reboote und spiel das nochmal durch.
Die Backup-Funktion ist wirklich wichtig für mich... -
@minkhx said in Fehler Backitup Grafana:
@minkhx history enabled auf true setzen?
Nee, erstmal lieber nicht:)
-
@minkhx Hmm, mit Node-Red wirds red, also wieder die Fehlermeldung.
-
@minkhx Wenn es Node_red kann keine Grafana Fehlermeldung ausgeben.
Bitte den Debuglog vo Backup zeigen -
@simatec Jo, das hab ich hier irgendwo gelesen mit dem Ändern auf debug-state. Ich hab aber keine Ahnung, wo die log ist, dummerweise.
Edit: Das hier?
backitup.0
	2025-05-23 22:33:30.863	error	[iobroker/grafana] cannot found Grafana Backup files
Edit2:
backitup.0 2025-05-23 22:33:32.824 warn [iobroker/clean] No older backup files are deleted, because this backup was started manually backitup.0 2025-05-23 22:33:30.863 error [iobroker/grafana] cannot found Grafana Backup files backitup.0 2025-05-23 22:32:53.086 warn [iobroker/clean] No older backup files are deleted, because this backup was started manually backitup.0 2025-05-23 22:32:50.989 error [iobroker/grafana] cannot found Grafana Backup files backitup.0 2025-05-23 22:27:49.895 warn [iobroker/clean] No older backup files are deleted, because this backup was started manually backitup.0 2025-05-23 22:27:47.936 error [iobroker/grafana] cannot found Grafana Backup files host.flowbox 2025-05-23 22:27:27.556 warn instance system.adapter.backitup.0 already running with pid 135751 backitup.0 2025-05-23 22:27:05.581 warn [iobroker/clean] No older backup files are deleted, because this backup was started manually backitup.0 2025-05-23 22:27:03.612 error [iobroker/grafana] cannot found Grafana Backup files -
@minkhx Bitte den kompletten Log vom Backup posten
-
@simatec Ja, klar, nicht das Protokoll, sondern den output...
mit Haken bei ioB, influx und Grafana.22:45:23.952 INFO gui Backup gestartet ... 22:45:30.750 DEBUG iobroker host.flowbox 193 objects saved 22:45:30.828 DEBUG iobroker host.flowbox 141 states saved 22:45:30.846 DEBUG iobroker host.flowbox "config.json" is valid 22:45:30.881 DEBUG iobroker host.flowbox "objects.jsonl" exists host.flowbox "states.jsonl" exists 22:45:31.767 DEBUG iobroker host.flowbox JSONL lines are valid 22:45:31.777 DEBUG iobroker host.flowbox The backup is valid! 22:45:33.948 DEBUG iobroker Backup created: /opt/iobroker/backups/iobroker_2025_05_23-22_45_24_backupiobroker.tar.gz 22:45:33.993 DEBUG iobroker This backup can only be restored with js-controller version 7.0 or higher 22:45:34.986 DEBUG iobroker done 22:45:35.147 DEBUG influxDB InfluxDB-Backup started ... 22:45:35.194 DEBUG influxDB Start InfluxDB Backup ... 22:45:35.205 DEBUG influxDB InfluxDB Backup tmp directory created 22:45:35.222 DEBUG influxDB Backup created: /opt/iobroker/backups/influxDB_2025_05_23-22_45_35_backupiobroker.tar.gz 22:45:35.235 DEBUG influxDB InfluxDB tmp directory "/opt/iobroker/backups/influxDB_2025_05_23-22_45_35_backupiobroker" successfully deleted 22:45:35.271 DEBUG influxDB InfluxDB-Backup for is finish 22:45:35.282 DEBUG influxDB done 22:45:36.486 DEBUG grafana Created grafana_tmp directory: "/opt/iobroker/backups/grafana_tmp" 22:45:36.502 DEBUG grafana Created dashboard directory 22:45:36.518 DEBUG grafana Created folder directory 22:45:36.521 DEBUG grafana Created dashboards_manually_restore directory 22:45:36.565 DEBUG grafana Created datasource directory 22:45:36.580 DEBUG grafana Grafana is available ... Status: 200 22:45:37.086 DEBUG grafana Saved dashboard-folder mapping 22:45:37.257 DEBUG grafana start Grafana backup compress ... 22:45:37.275 DEBUG grafana Try deleting the Grafana tmp directory: "/opt/iobroker/backups/grafana_tmp" 22:45:37.290 DEBUG grafana Grafana tmp directory "/opt/iobroker/backups/grafana_tmp" successfully deleted 22:45:37.330 ERROR grafana cannot found Grafana Backup files 22:45:37.339 DEBUG grafana done 22:45:39.238 WARN clean No older backup files are deleted, because this backup was started manually 22:45:39.277 DEBUG clean done 22:45:39.402 DEBUG historyHTML new history html values created 22:45:39.495 DEBUG historyHTML done 22:45:39.660 DEBUG historyJSON new history json values created 22:45:39.705 DEBUG historyJSON done 22:45:42.176 DEBUG notification done 22:45:42.333 INFO gui Das Backup wurde erfolgreich erstellt!EDIT:
Z109-113 - Wenn der das immer deleted, kanner ja auch nix finden, oder? Vllt. ist das gar nicht so schlimm? -
@minkhx Wie sieht denn das Grafana Backup aus? Ist da was drin? Zeige mal den Log, wo es funktioniert hat. In dem Log steht ja nix zur Sicherung von Dashboards