Navigation

    Logo
    • Register
    • Login
    • Search
    • Recent
    • Tags
    • Unread
    • Categories
    • Unreplied
    • Popular
    • GitHub
    • Docu
    • Hilfe
    1. Home
    2. Deutsch
    3. Off Topic
    4. Proxmox
    5. Showcase: SSD und HDD Gesundheitszustand überwachen

    NEWS

    • Neuer Blog: Fotos und Eindrücke aus Solingen

    • ioBroker@Smart Living Forum Solingen, 14.06. - Agenda added

    • ioBroker goes Matter ... Matter Adapter in Stable

    Showcase: SSD und HDD Gesundheitszustand überwachen

    This topic has been deleted. Only users with topic management privileges can see it.
    • MartinP
      MartinP last edited by MartinP

      Ich lese auf dem PVE-Hypervisor Linux per bash script im cron job S.M.A.R.T Parameter der System SSD und einer 4TB USB-HDD ein und schreibe per SimpleAPI einige mir interessant vorkommende Parameter nach "userdata". Alle 4 Stunden zur 11. Minute der Stunde werden die Werte aktualisert.

      S.M.A.R.T Ausgabe meiner USB-HDD


      root@pve:~/skripte# smartctl -a -d sat /dev/sdb
      smartctl 7.3 2022-02-28 r5338 [x86_64-linux-6.8.12-2-pve] (local build)
      Copyright (C) 2002-22, Bruce Allen, Christian Franke, www.smartmontools.org

      === START OF INFORMATION SECTION ===
      Model Family: Seagate BarraCuda 3.5 (SMR)
      Device Model: ST4000DM004-2CV104
      Serial Number: Z9703MW4
      LU WWN Device Id: 5 000c50 0a28fd89c
      Firmware Version: 0001
      User Capacity: 4,000,787,030,016 bytes [4.00 TB]
      Sector Sizes: 512 bytes logical, 4096 bytes physical
      Rotation Rate: 5425 rpm
      Device is: In smartctl database 7.3/5319
      ATA Version is: ACS-3 T13/2161-D revision 5
      SATA Version is: SATA 3.1, 6.0 Gb/s (current: 6.0 Gb/s)
      Local Time is: Mon Sep 30 17:40:12 2024 CEST
      SMART support is: Available - device has SMART capability.
      SMART support is: Enabled

      === START OF READ SMART DATA SECTION ===
      SMART Status command failed: scsi error unsupported scsi opcode
      SMART overall-health self-assessment test result: PASSED
      Warning: This result is based on an Attribute check.

      General SMART Values:
      Offline data collection status: (0x82) Offline data collection activity
      was completed without error.
      Auto Offline Data Collection: Enabled.
      Self-test execution status: ( 0) The previous self-test routine completed
      without error or no self-test has ever
      been run.
      Total time to complete Offline
      data collection: ( 0) seconds.
      Offline data collection
      capabilities: (0x7b) SMART execute Offline immediate.
      Auto Offline data collection on/off support.
      Suspend Offline collection upon new
      command.
      Offline surface scan supported.
      Self-test supported.
      Conveyance Self-test supported.
      Selective Self-test supported.
      SMART capabilities: (0x0003) Saves SMART data before entering
      power-saving mode.
      Supports SMART auto save timer.
      Error logging capability: (0x01) Error logging supported.
      General Purpose Logging supported.
      Short self-test routine
      recommended polling time: ( 1) minutes.
      Extended self-test routine
      recommended polling time: ( 478) minutes.
      Conveyance self-test routine
      recommended polling time: ( 2) minutes.
      SCT capabilities: (0x30a5) SCT Status supported.
      SCT Data Table supported.

      SMART Attributes Data Structure revision number: 10
      Vendor Specific SMART Attributes with ThBildschirmfoto vom 2024-09-30 19-24-36resholds:
      ID# ATTRIBUTE_NAME FLAG VALUE WORST THRESH TYPE UPDATED WHEN_FAILED RAW_VALUE
      1 Raw_Read_Error_Rate 0x000f 081 063 006 Pre-fail Always - 242543912
      3 Spin_Up_Time 0x0003 096 096 000 Pre-fail Always - 0
      4 Start_Stop_Count 0x0032 037 037 020 Old_age Always - 65535
      5 Reallocated_Sector_Ct 0x0033 100 100 010 Pre-fail Always - 0
      7 Seek_Error_Rate 0x000f 087 060 030 Pre-fail Always - 475250992
      9 Power_On_Hours 0x0032 039 039 000 Old_age Always - 54198h+57m+44.554s
      10 Spin_Retry_Count 0x0013 100 100 097 Pre-fail Always - 0
      12 Power_Cycle_Count 0x0032 100 100 020 Old_age Always - 28
      183 Runtime_Bad_Block 0x0032 100 100 000 Old_age Always - 0
      184 End-to-End_Error 0x0032 100 100 099 Old_age Always - 0
      187 Reported_Uncorrect 0x0032 100 100 000 Old_age Always - 0
      188 Command_Timeout 0x0032 100 099 000 Old_age Always - 1 1 1
      189 High_Fly_Writes 0x003a 100 100 000 Old_age Always - 0
      190 Airflow_Temperature_Cel 0x0022 071 049 040 Old_age Always - 29 (Min/Max 25/36)
      191 G-Sense_Error_Rate 0x0032 100 100 000 Old_age Always - 0
      192 Power-Off_Retract_Count 0x0032 100 100 000 Old_age Always - 279
      193 Load_Cycle_Count 0x0032 008 008 000 Old_age Always - 185700
      194 Temperature_Celsius 0x0022 029 051 000 Old_age Always - 29 (0 18 0 0 0)
      195 Hardware_ECC_Recovered 0x001a 084 064 000 Old_age Always - 242543912
      197 Current_Pending_Sector 0x0012 100 100 000 Old_age Always - 0
      198 Offline_Uncorrectable 0x0010 100 100 000 Old_age Offline - 0
      199 UDMA_CRC_Error_Count 0x003e 200 200 000 Old_age Always - 0
      240 Head_Flying_Hours 0x0000 100 253 000 Old_age Offline - 17864h+29m+54.542s
      241 Total_LBAs_Written 0x0000 100 253 000 Old_age Offline - 9900390920
      242 Total_LBAs_Read 0x0000 100 253 000 Old_age Offline - 10644847568

      SMART Error Log Version: 1
      No Errors Logged

      SMART Self-test log structure revision number 1
      No self-tests have been logged. [To run self-tests, use: smartctl -t]

      SMART Selective self-test log data structure revision number 1
      SPAN MIN_LBA MAX_LBA CURRENT_TEST_STATUS
      1 0 0 Not_testing
      2 0 0 Not_testing
      3 0 0 Not_testing
      4 0 0 Not_testing
      5 0 0 Not_testing
      Selective self-test flags (0x0):
      After scanning selected spans, do NOT read-scan remainder of disk.
      If Selective self-test is pending on power-up, resume after 0 minute delay.

      Interessant fand ich da Seek_Error_Rate und Raw_Read_Error_Rate

      Die entsprechenden Zeilen sehen so aus ...

      ID# ATTRIBUTE_NAME          FLAG     VALUE WORST THRESH TYPE      UPDATED  WHEN_FAILED RAW_VALUE
      ...
        1 Raw_Read_Error_Rate     0x000f   081   063   006    Pre-fail  Always       -       242543912
      ...
        7 Seek_Error_Rate         0x000f   087   060   030    Pre-fail  Always       -       475250992
      

      Interessant ist "VALUE", da der Wert "normalisiert ist, gilt, je höher, desto besser Maximum ist 100. Gibt den aktuellen Wert wieder.
      "WORST" ist da schlechteste jemals gemessene Wert.
      "THRESH" ist der Schwellwert, bei dem ein Defekt sehr nahe ist.

      Bei der SSD habe ich erstmal weniger Parameter angedacht, da fehlt womöglich noch etwas.
      An einigen Stellen differieren die Parameter, sodass die angedachte allgemeine Einlese-Funktion nicht möglich ist - schon für diese beiden Platten habe ich individuelle Funktionen bauen müssen...

      Hier die komplette Ausgabe der SSD


      smartctl 7.3 2022-02-28 r5338 [x86_64-linux-6.8.12-2-pve] (local build)
      Copyright (C) 2002-22, Bruce Allen, Christian Franke, www.smartmontools.org

      === START OF INFORMATION SECTION ===
      Model Family: Crucial/Micron Client SSDs
      Device Model: CT480BX500SSD1
      Serial Number: 2248E68B04B2
      LU WWN Device Id: 5 00a075 1e68b04b2
      Firmware Version: M6CR056
      User Capacity: 480,103,981,056 bytes [480 GB]
      Sector Size: 512 bytes logical/physical
      Rotation Rate: Solid State Device
      Form Factor: 2.5 inches
      TRIM Command: Available
      Device is: In smartctl database 7.3/5319
      ATA Version is: ACS-3 T13/2161-D revision 4
      SATA Version is: SATA 3.3, 6.0 Gb/s (current: 6.0 Gb/s)
      Local Time is: Mon Sep 30 15:43:51 2024 CEST
      SMART support is: Available - device has SMART capability.
      SMART support is: Enabled

      === START OF READ SMART DATA SECTION ===
      SMART overall-health self-assessment test result: PASSED

      General SMART Values:
      Offline data collection status: (0x00) Offline data collection activity
      was never started.
      Auto Offline Data Collection: Disabled.
      Self-test execution status: ( 0) The previous self-test routine completed
      without error or no self-test has ever
      been run.
      Total time to complete Offline curl $SimpleApiUrl$1"NormalizedReadErrorRate?value="$(awk '/Raw_Read_Error_Rate/{print $4}' Testdata.txt);
      data collection: ( 120) seconds.
      Offline data collection
      capabilities: (0x11) SMART execute Offline immediate.
      No Auto Offline data collection support.
      Suspend Offline collection upon new
      command.
      No Offline surface scan supported.
      Self-test supported.
      No Conveyance Self-test supported.
      No Selective Self-test supported.
      SMART capabilities: (0x0002) Does not save SMART data before
      entering power-saving mode.
      Supports SMART auto save timer.
      Error logging capability: (0x01) Error logging supported.
      General Purpose Logging supported.
      Short self-test routine
      recommended polling time: ( 2) minutes.
      Extended self-test routine
      recommended polling time: ( 10) minutes.

      SMART Attributes Data Structure revision number: 16
      Vendor Specific SMART Attributes with ThrBildschirmfoto vom 2024-09-30 19-24-36esholds:
      ID# ATTRIBUTE_NAME FLAG VALUE WORST THRESH TYPE UPDATED WHEN_FAILED RAW_VALUE
      1 Raw_Read_Error_Rate 0x002f 100 100 000 Pre-fail Always - 0
      5 Reallocate_NAND_Blk_Cnt 0x0032 100 100 010 Old_age Always - 0
      9 Power_On_Hours 0x0032 100 100 000 Old_age Always - 14036
      12 Power_Cycle_Count 0x0032 100 100 000 Old_age Always - 54
      171 Program_Fail_Count 0x0032 100 100 000 Old_age Always - 0
      172 Erase_Fail_Count 0x0032 100 100 000 Old_age Always - 0
      173 Ave_Block-Erase_Count 0x0032 092 092 000 Old_age Always - 82
      174 Unexpect_Power_Loss_Ct 0x0032 100 100 000 Old_age Always - 37
      180 Unused_Reserve_NAND_Blk 0x0033 100 100 000 Pre-fail Always - 49
      183 SATA_Interfac_Downshift 0x0032 100curl $SimpleApiUrl$1"NormalizedReadErrorRate?value="$(awk '/Raw_Read_Error_Rate/{print $4}' Testdata.txt); 100 000 Old_age Always - 0
      184 Error_Correction_Count 0x0032 100 100 000 Old_age Always - 0
      187 Reported_Uncorrect 0x0032 100 100 000 Old_age Always - 0
      194 Temperature_Celsius 0x0022 068 056 000 Old_age Always - 32 (Min/Max 23/44)
      196 Reallocated_Event_Count 0x0032 100 100 000 Old_age Always - 0
      197 Current_Pending_ECC_Cnt 0x0032 100 100 000 Old_age Always - 0
      198 Offline_Uncorrectable 0x0030 100 100 000 Old_age Offline - 0
      199 UDMA_CRC_Error_Count 0x0032 100 100 000 Old_age Always - 0
      202 Percent_Lifetime_Remain 0x0030 092 092 001 Old_age Offline - 8
      206 Write_Error_Rate 0x000e 100 100 000 Old_age Always - 0
      210 Success_RAIN_Recov_Cnt 0x0032 100 100 000 Old_age Always - 0
      246 Total_LBAs_Written 0x0032 100 100 000 Old_age Always - 12866293454
      247 Host_Program_Page_Count 0x0032 100 100 000 Old_age Always - 402071670
      248 FTL_Program_Page_Count 0x0032 100 100 000 Old_age Always - 320343776
      249 Unkn_CrucialMicron_Attr 0x0032 100 100 000 Old_age Always - 0
      250 Read_Error_Retry_Rate 0x0032 100 100 000 Old_age Always - 0
      251 Unkn_CrucialMicron_Attr 0x0032 100 100 000 Old_age Always - 1625002101
      252 Unkn_CrucialMicron_Attr 0x0032 100 100 000 Old_age Always - 441
      253 Unkn_CrucialMicron_Attr 0x0032 100 100 000 Old_age Always - 0
      254 Unkn_CrucialMicron_Attr 0x0032 100 100 000 Old_age Always - 37
      223 Unkn_CrucialMicron_Attr 0x0032 100 100 000 Old_age Always - 0

      SMART Error Log not supported

      SMART Self-test log structure revision number 1
      No self-tests have been logged. [To run self-tests, use: smartctl -t]

      Selective Self-tests/Logging not supported

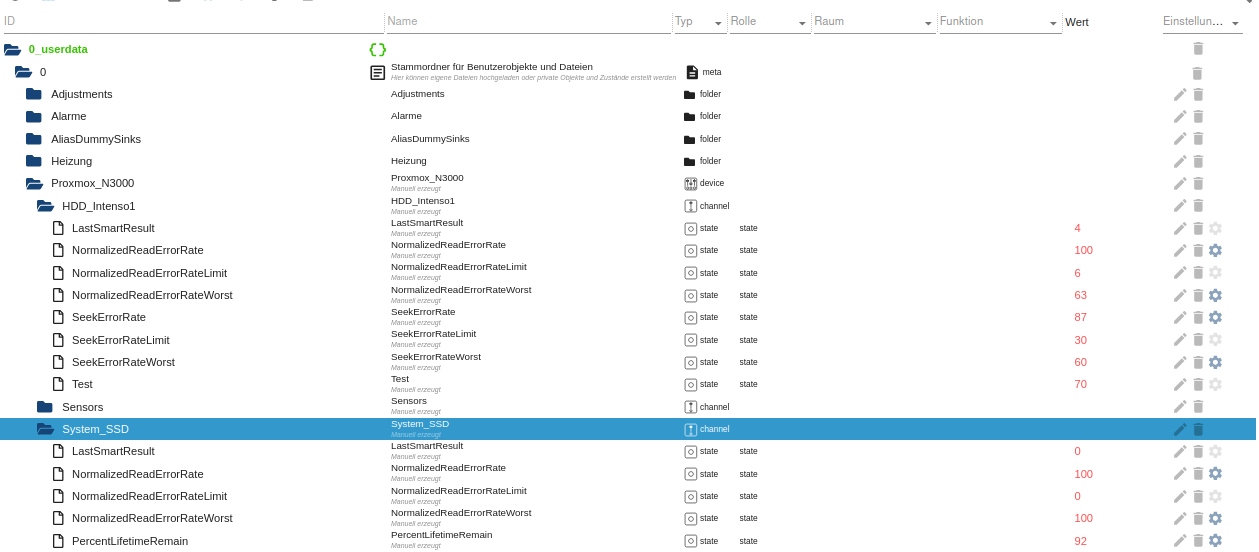
      Neben der "Raw_Read_Error_Rate" habe ich nur "VALUE" aus...

      Percent_Lifetime_Remain 0x0030   092   092   001    Old_age   Offline      -       8
      

      .... extrahiert

      Das Bash-Script wird auf dem PVE-System selber ausgeführt

      Erst wird eine Textdatei mit dem Output von Smartctrl erzeugt, dann wird diese passend in der entsprechenden Funktion zerlegt

      # Intenso USB hdd
      smartctl -a -d sat /dev/sdb >Testdata.txt
      write_userdata_hdd "Proxmox_N3000.HDD_Intenso1."
      
      
      # system SSD
      smartctl -a /dev/sda >Testdata.txt
      write_userdata_ssd "Proxmox_N3000.System_SSD."
      

      Hier der ganze Code:

       #!/usr/bin/bash 
      
      
      # to make script ready for cron
      PATH=/usr/local/sbin:/usr/local/bin:/usr/sbin:/usr/bin:/sbin:/bin
      
      
      SimpleApiUrl="http://192.168.2.201:8087/set/0_userdata.0."
      
      
      echo "test_hdd_data.sh drive health check started" > /root/scripte/Proxmox_Skripte/last_run.log
      
      # parameter §1 is subpath (no leading dot but a trailing dot
      function write_userdata_hdd()
      {
        # normalized read error rate
      
        # use simple api to write to iobroker
        # example: http://192.168.1.:8087/set/javascript.0.test?value=1
      
        # ReadErrorRate and ReadErrorRateWorst should be ABOVE ReadErrorRateLimit
        # decreasing distance to limit is an indicator for hdd getting worse 
      
        curl $SimpleApiUrl$1"NormalizedReadErrorRate?value="$(awk '/Raw_Read_Error_Rate/{print $4}' /root/scripte/Proxmox_Skripte/Testdata.txt);
        curl $SimpleApiUrl$1"NormalizedReadErrorRateWorst?value="$(awk '/Raw_Read_Error_Rate/{print $5}' /root/scripte/Proxmox_Skripte/Testdata.txt);
        curl $SimpleApiUrl$1"NormalizedReadErrorRateLimit?value="$(awk '/Raw_Read_Error_Rate/{print $6}' /root/scripte/Proxmox_Skripte/Testdata.txt);
      
        # SeekErrorRate and SeekErrorRateWorst should be ABOVE SeekErrorRateLimit
        # decreasing distance to limit is an indicator for hdd getting worse 
      
        curl $SimpleApiUrl$1"SeekErrorRate?value="$(awk '/Seek_Error_Rate/{print $4}' /root/scripte/Proxmox_Skripte/Testdata.txt);
        curl $SimpleApiUrl$1"SeekErrorRateWorst?value="$(awk '/Seek_Error_Rate/{print $5}' /root/scripte/Proxmox_Skripte/Testdata.txt);
        curl $SimpleApiUrl$1"SeekErrorRateLimit?value="$(awk '/Seek_Error_Rate/{print $6}' /root/scripte/Proxmox_Skripte/Testdata.txt);
        curl $SimpleApiUrl$1"LastSmartResult?value="$2
      
      }


      function write_userdata_ssd()
      {
        # normalized read error rate
      
        # use simple api to write to iobroker
        # example: http://192.168.1.:8087/set/javascript.0.test?value=1
      
        # ReadErrorRate and ReadErrorRateWorst should be ABOVE ReadErrorRateLimit
        # decreasing distance to limit is an indicator for hdd getting worse 
      
        curl $SimpleApiUrl$1"NormalizedReadErrorRate?value="$(awk '/Raw_Read_Error_Rate/{print $4}' /root/scripte/Proxmox_Skripte/Testdata.txt);
        curl $SimpleApiUrl$1"NormalizedReadErrorRateWorst?value="$(awk '/Raw_Read_Error_Rate/{print $5}' /root/scripte/Proxmox_Skripte/Testdata.txt);
        curl $SimpleApiUrl$1"NormalizedReadErrorRateLimit?value="$(awk '/Raw_Read_Error_Rate/{print $6}' /root/scripte/Proxmox_Skripte/Testdata.txt);
      
        # SeekErrorRate and SeekErrorRateWorst should be ABOVE SeekErrorRateLimit
        # decreasing distance to limit is an indicator for hdd getting worse 
      
        curl $SimpleApiUrl$1"PercentLifetimeRemain?value="$(awk '/Percent_Lifetime_Remain/{print $4}' /root/scripte/Proxmox_Skripte/Testdata.txt);
        curl $SimpleApiUrl$1"LastSmartResult?value="$2
      
      }
      
      # write smartctl of hdds of interest to file and analyze results
      
      # for test purpose comment out smartctl invocations and invoke write_userdata_... functions with off script got Testdata.txt
      # even possible on different linux machine
      
      # Intenso USB hdd
      smartctl -a -d sat /dev/sdb >/root/scripte/Proxmox_Skripte/Testdata.txt
      result=$?
      echo " test_hdd_data.sh drive health check data of usb hdd retrieved result="$result >> /root/scripte/Proxmox_Skripte/last_run.log
      
      
      write_userdata_hdd "Proxmox_N3000.HDD_Intenso1." $result
      
      
      # system SSD
      smartctl -a /dev/sda >/root/scripte/Proxmox_Skripte/Testdata.txt
      result=$?
      echo " test_hdd_data.sh drive health check data of system ssd retrieved result="$result >> /root/scripte/Proxmox_Skripte/last_run.log
      write_userdata_ssd "Proxmox_N3000.System_SSD." $result
      
      
      echo " test_hdd_data.sh drive health check finished" >> /root/scripte/Proxmox_Skripte/last_run.log
      

      Hier die Datenpunkte, die ich manuell in Userdata erzeugt habe:

      7d852509-6eea-4fbc-89af-bab5dfcb21b3-grafik.png
      Und das der Eintrag in die root crontab (da man für smartmontools eh sudo braucht... habe aber zumindest die sh Datei readonly gemacht)

      11 */4 * * * bash /root/skripte/check_usb_hdd.sh 2>&1 /dev/null
      
      MartinP OliverIO 2 Replies Last reply Reply Quote 2
      • MartinP
        MartinP @MartinP last edited by MartinP

        Hier noch die erste Grafana Auswertung der Messwerte als "Fieberkurven" vielleicht mache ich mir daraus auch noch Gauge-Views, aber da verliert man den Blick auf den "Trend"

        Bei der SSD stehen die Thresholds für Alarm alle auf Null, also habe ich mir da auch nichts eingezeichnet, bei der HDD gibt es für Read-Errors eine Threshold von 6, für Seek-Errors einen von 30 - den habe ich da als roten dünnen Hintergrund dahintergeklemmt

        713cb7d7-4c33-435d-9024-927262f3730f-grafik.png

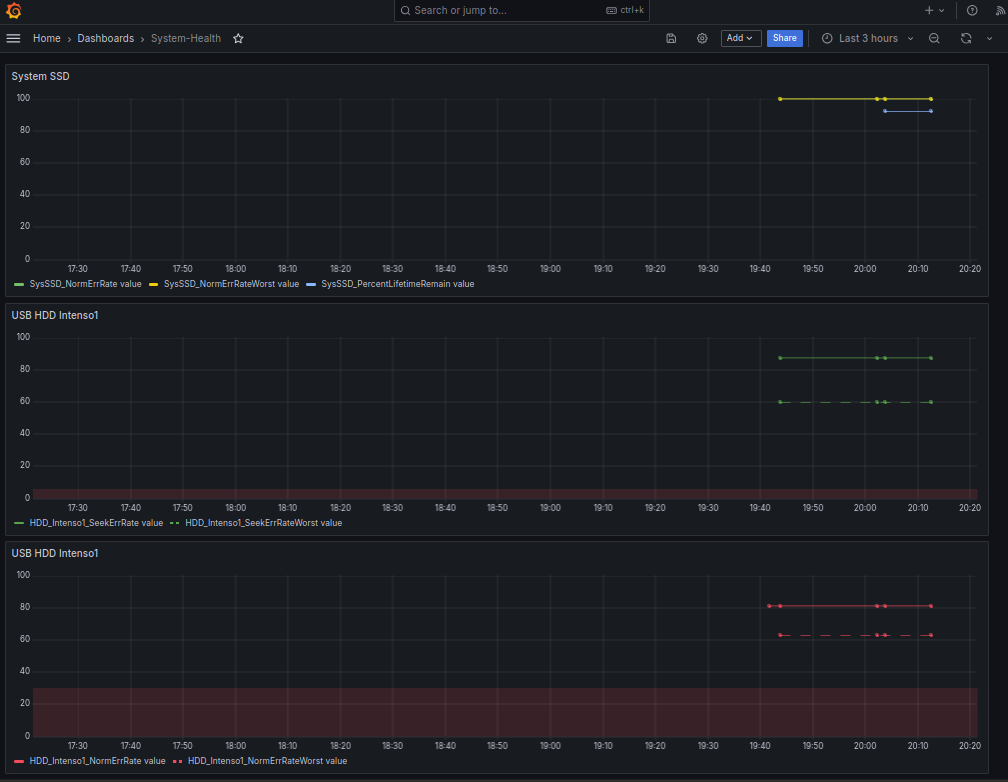
        Um da nicht vier Stunden auf Messwerte zu warten (wenn Cron mal wieder gefeuert hat), habe ich zwischendurch das Script einige Male von Hand gestartet

        1 Reply Last reply Reply Quote 0
        • OliverIO
          OliverIO @MartinP last edited by OliverIO

          @martinp

          ChatGPT sag mir, dass diese Parameter wichtig sind

          Dein SSD-Status zeigt, dass die SMART-Gesundheitsprüfung bestanden wurde. Hier sind die wichtigsten Punkte:

          1. Gesundheitszustand: „PASSED“ (keine Probleme erkannt).
          2. Betriebsstunden: 14.036 Stunden.
          3. Restleben: 92 % (das bedeutet, dass die SSD noch eine gute Lebensdauer hat).
          4. Reallocated Blocks: 0 (keine fehlerhaften Blöcke).
          5. Temperatur: 32 °C (normal).

          Insgesamt sieht es so aus, als ob deine SSD gut funktioniert. Du solltest regelmäßig Backups machen und die SMART-Werte im Auge behalten.

          MartinP 1 Reply Last reply Reply Quote 0
          • MartinP
            MartinP @OliverIO last edited by MartinP

            @oliverio Hatte noch Probleme, dass das Script zwar aus der Console gestartet gelaufen ist, aber aus dem cron nicht funktioniert hat ...

            Nach Internetrecherche kriegt die Shell anscheinend nicht alle ENV-Einträge der normalen Umgebung

            Mit "env" kann man sich das anschauen

            Crontab-Eintrag, um zu schauen, wie das Env im cron aussieht:

            * * * * * env >mist.env
            

            mist.env

            HOME=/root
            LOGNAME=root
            PATH=/usr/bin:/bin
            LANG=en_US.UTF-8
            SHELL=/bin/sh
            PWD=/root
            

            env aus der konsole

            SHELL=/bin/bash
            PWD=/root
            LOGNAME=root
            XDG_SESSION_TYPE=tty
            MOTD_SHOWN=pam
            HOME=/root
            LANG=en_US.UTF-8
            XDG_SESSION_CLASS=user
            TERM=xterm-256color
            USER=root
            SHLVL=1
            XDG_SESSION_ID=19428
            XDG_RUNTIME_DIR=/run/user/0
            HUSHLOGIN=FALSE
            PATH=/usr/local/sbin:/usr/local/bin:/usr/sbin:/usr/bin:/sbin:/bin
            DBUS_SESSION_BUS_ADDRESS=unix:path=/run/user/0/bus
            MAIL=/var/mail/root
            _=/usr/bin/env
            OLDPWD=/root/scripte/Proxmox_Skripte
            

            habe mir den PATH aus der Konsole in das Bash Script an den Anfang kopiert und jetzt läuft das Script auch aus dem cron

            Neueste Version, mit Auswertung des Rückgabewertes habe ich im obersten Beitrag abgelegt, das alte Listing ersetzt

            MartinP 1 Reply Last reply Reply Quote 0
            • MartinP
              MartinP @MartinP last edited by MartinP

              Interessanterweise gibt es bei der USB-HDD einen Returncode !=0

              Bei der SSD kommt immer eine 0 (alles O.K.) als "result" zurück, bei der HDD eine 4... also Bit 2 gesetzt ...

              ich vermute, aufgrund der folgenden Fehlermeldung mit anschließender Warnung

              ...
              === START OF READ SMART DATA SECTION ===
              SMART Status command failed: scsi error unsupported scsi opcode
              SMART overall-health self-assessment test result: PASSED
              Warning: This result is based on an Attribute check.
              ....
              
              smartctl -a /dev/sda >/root/scripte/Proxmox_Skripte/Testdata.txt
              result=$?
              

              Das bedeutet laut untenstehendem ...

              Return Values

              The return values of smartctl are defined by a bitmask. If all is well with the disk, the return value (exit status) of smartctl is 0 (all bits turned off). If a problem occurs, or an error, potential error, or fault is detected, then a non-zero status is returned. In this case, the eight different bits in the return value have the following meanings for ATA disks; some of these values may also be returned for SCSI disks.

              Bit 0:

              Command line did not parse.

              Bit 1:

              Device open failed, device did not return an IDENTIFY DEVICE structure, or device is in a low-power mode (see '-n' option above).

              Bit 2:

              Some SMART or other ATA command to the disk failed, or there was a checksum error in a SMART data structure (see '-b' option above).

              Bit 3:

              SMART status check returned "DISK FAILING".

              Bit 4:

              We found prefail Attributes <= threshold.

              Bit 5:

              SMART status check returned "DISK OK" but we found that some (usage or prefail) Attributes have been <= threshold at some time in the past.

              Bit 6:

              The device error log contains records of errors.

              Bit 7:

              The device self-test log contains records of errors. [ATA only] Failed self-tests outdated by a newer successful extended self-test are ignored.
              To test within the shell for whether or not the different bits are turned on or off, you can use the following type of construction (this is bash syntax):

              smartstat=$(($? & 8))

              This looks at only at bit 3 of the exit status $? (since 8=2^3). The shell variable $smartstat will be nonzero if SMART status check returned "disk failing" and zero otherwise.

              This bash script prints all status bits:

              status=$?
              for ((i=0; i<8; i++)); do
              echo "Bit $i: $((status & 2**i && 1))"
              done

              1 Reply Last reply Reply Quote 0
              • First post
                Last post

              Support us

              ioBroker
              Community Adapters
              Donate

              816
              Online

              31.8k
              Users

              80.0k
              Topics

              1.3m
              Posts

              bash curl s.m.a.r.t showcase
              2
              5
              321
              Loading More Posts
              • Oldest to Newest
              • Newest to Oldest
              • Most Votes
              Reply
              • Reply as topic
              Log in to reply
              Community
              Impressum | Datenschutz-Bestimmungen | Nutzungsbedingungen
              The ioBroker Community 2014-2023
              logo