Backitup Fehlermeldung bei Grafana Backup
-
Ja, ich bei mir schon:
-
@michaelf da gibt es mit der API gerade Probleme. Ohne Unterordner werden sicher alle Dashboards gesichert
-
@michaelf Bitte teste die aktuelle Github Version und poste hier den Debuglog. Hier sollte nun im Backup ein weitere Ordner für die Folder angelegt sein
-
Funktioniert:
08:43:06.808DEBUGgrafanaStart Grafana Backup ... 08:43:06.825DEBUGgrafanaCreated grafana_tmp directory: "/opt/iobroker/backups/grafana_tmp" 08:43:06.868DEBUGgrafanaCreated dashboards_manually_restore directory 08:43:06.904DEBUGgrafanaCreated datasource directory 08:43:06.911DEBUGgrafanastart Grafana request ... 08:43:07.386DEBUGgrafanaGrafana is available ... Status: 200 08:43:07.952DEBUGgrafanafound Dashboard: awattar 08:43:08.161DEBUGgrafanafound Dashboard: evcc3a-monat 08:43:08.196DEBUGgrafanafound Dashboard: evcc3a-today-details 08:43:08.275DEBUGgrafanafound Dashboard: status 08:43:08.369DEBUGgrafanafound Dashboard: evcc3a-all-time 08:43:08.386DEBUGgrafanafound Dashboard: jahresverbrauch 08:43:08.411DEBUGgrafanafound Dashboard: solarspeicher 08:43:08.428DEBUGgrafanafound Dashboard: evcc3a-jahr 08:43:08.490DEBUGgrafanafound Dashboard: evcc3a-today-mobile 08:43:08.568DEBUGgrafanafound Dashboard: evcc3a-today 08:43:08.573DEBUGgrafanafound Dashboard: sonoff-pow-new 08:43:08.924DEBUGgrafanaSave Folder "PV" 08:43:08.943DEBUGgrafanastart Grafana backup compress ... 08:43:13.745DEBUGgrafanaBackup created: /opt/iobroker/backups/grafana_2025_05_14-08_42_29_backupiobroker.tar.gz 08:43:13.753DEBUGgrafanaGrafana tmp directory "/opt/iobroker/backups/grafana_tmp" successfully deleted 08:43:13.790DEBUGgrafanadone -
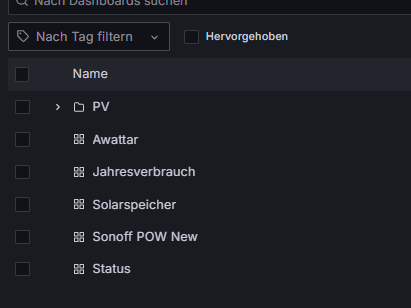
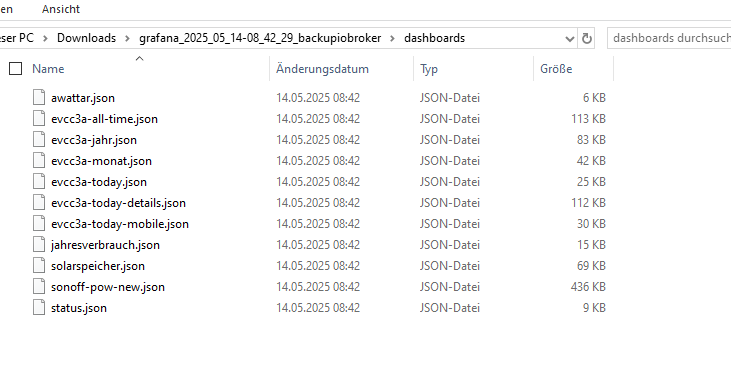
@michaelf Kannst du bitte prüfen, ob alle Dashboards und alle Folder gesichert wurden. Du kannst die Backupdatei auf deinen PC runterladen und öffnen
-
@simatec soweit ich das beurteilen kann, ja, denke sind alle da:
-
@michaelf Gut dann schaue ich mir heute Abend mal das Thema Restore an... Hier muss ich auch noch was testen, damit Folder wiederhergestellt werden und die Dashboards in den Folder landen
-
Ja, ich nutze auch Unterordner in Grafana.
-
@umbm dann teste bitte auch mal die aktuelle Githubversion. Das Problem tritt aktuell nur in Verbindung mit Grafana 12.0.0 auf
-
Hallo Forum,
ich habe dasselbe Problem. Bei mir sind auch Ordner in Grafana vorhanden.
Unten sind meine Logs.
Soll ich eine Lösung abwarten?
Danke und Grüße404","name":"AxiosError","stack":"AxiosError: Request failed with status code 404\n at settle (/opt/iobroker/node_modules/axios/dist/node/axios.cjs:2031:12)\n at IncomingMessage.handleStreamEnd (/opt/iobroker/node_modules/axios/dist/node/axios.cjs:3148:11)\n at IncomingMessage.emit (node:events:536:35)\n at endReadableNT (node:internal/streams/readable:1698:12)\n at process.processTicksAndRejections (node:internal/process/task_queues:82:21)\n at Axios.request (/opt/iobroker/node_modules/axios/dist/node/axios.cjs:4258:41)\n at process.processTicksAndRejections (node:internal/process/task_queues:95:5)\n at async /opt/iobroker/node_modules/iobroker.backitup/lib/scripts/36-grafana.js:93:44\n at async Promise.all (index 0)","config":{"transitional":{"silentJSONParsing":true, "forcedJSONParsing":true,"clarifyTimeoutError":false},"adapter":["xhr","http","fetch"], "transformRequest":[null],"transformResponse":[null],"timeout":0,"xsrfCookieName":"XSRF-TOKEN", "xsrfHeaderName":"X-XSRF-TOKEN","maxContentLength":-1,"maxBodyLength":-1,"env":{},"headers":{"Accept": "application/json, text/plain, */*","Authorization":"Bearer ****","User-Agent":"axios/1.8.4", "Accept-Encoding":"gzip, compress, deflate, br"},"method":"get","url": "http://192.168.178.10:3000/api/dashboards/uid/ee6zqf4dq7ncwa","responseType":"json","httpsAgent": {"_events":{},"_eventsCount":2,"_maxListeners":100,"defaultPort":443,"protocol":"https:", "options":{"rejectUnauthorized":true,"noDelay":true,"path":null},"requests":{},"sockets":{}, "freeSockets":{},"keepAliveMsecs":1000,"keepAlive":false,"maxSockets":null,"maxFreeSockets":256, "scheduling":"lifo","maxTotalSockets":null,"totalSocketCount":0,"maxCachedSessions":100,"_sessionCache": {"map":{},"list":[]}},"allowAbsoluteUrls":true},"code":"ERR_BAD_REQUEST","status":404}13:46:48.334INFOguiBackup gestartet ... 13:46:58.449DEBUGmountcifs-mount command: "sudo mount -t cifs -o username=iobrokerBackup,password=****,noserverino,cache=loose,rw,forceuid,uid=iobroker,forcegid,gid=iobroker,file_mode=0777,dir_mode=0777,vers=1.0 //fritz.box/fritz.box/MemoryBoard/Share/Backup/ioBroker /opt/iobroker/backups" 13:46:58.518DEBUGmountfirst mount attempt with smb option failed. try next mount attempt without smb option ... 13:46:58.527DEBUGmountcifs-mount command: "sudo mount -t cifs -o username=iobrokerBackup,password=****,noserverino,cache=loose,rw,forceuid,uid=iobroker,forcegid,gid=iobroker,file_mode=0777,dir_mode=0777 //fritz.box/fritz.box/MemoryBoard/Share/Backup/ioBroker /opt/iobroker/backups" 13:46:58.744DEBUGmountmount successfully completed 13:46:58.785DEBUGmountdone 13:47:04.430DEBUGiobrokerhost.raspi 9580 objects saved 13:47:05.339DEBUGiobrokerhost.raspi 8233 states saved 13:47:05.396DEBUGiobrokerhost.raspi Validating backup ... 13:47:05.400DEBUGiobrokerhost.raspi "config.json" is valid host.raspi "objects.jsonl" exists host.raspi "states.jsonl" exists 13:47:06.080DEBUGiobrokerhost.raspi JSONL lines are valid 13:47:06.085DEBUGiobrokerhost.raspi The backup is valid! 13:47:10.982DEBUGiobrokerBackup created: /opt/iobroker/backups/iobroker_2025_05_15-13_46_57_backupiobroker.tar.gz 13:47:10.993DEBUGiobrokerThis backup can only be restored with js-controller version 7.0 or higher 13:47:12.092DEBUGiobrokerdone 13:47:13.476DEBUGgrafanaStart Grafana Backup ... 13:47:13.769DEBUGgrafanaCreated grafana_tmp directory: "/opt/iobroker/backups/grafana_tmp" 13:47:14.068DEBUGgrafanaCreated dashboard directory 13:47:14.348DEBUGgrafanaCreated dashboards_manually_restore directory 13:47:14.637DEBUGgrafanaCreated datasource directory 13:47:14.645DEBUGgrafanastart Grafana request ... 13:47:14.680DEBUGgrafanaGrafana is available ... Status: 200 13:47:15.652ERRORgrafanaError on Grafana Dashboard ee6zqf4dq7ncwa backup: AxiosError: Request failed with status code 404 13:47:15.655DEBUGgrafanafound Dashboard: energie 13:47:15.734ERRORgrafanaError on Grafana Dashboard ce6zq9xqztp8gd backup: AxiosError: Request failed with status code 404 13:47:15.740DEBUGgrafanafound Dashboard: heizung 13:47:15.768ERRORgrafanaError on Grafana Dashboard backup: TypeError: Cannot read properties of undefined (reading 'data') 13:47:15.779DEBUGgrafanastart Grafana backup compress ... 13:47:15.833ERRORgrafanaError on Grafana Dashboard de6zqdiu6f400c backup: AxiosError: Request failed with status code 404 13:47:15.838DEBUGgrafanafound Dashboard: funk 13:47:15.928DEBUGgrafanafound Dashboard: verbrauch-hz-taglich 13:47:16.177DEBUGgrafanaTry deleting the Grafana tmp directory: "/opt/iobroker/backups/grafana_tmp" 13:47:16.311DEBUGgrafanafound Dashboard: temperatur-shelly 13:47:16.321DEBUGgrafanafound Dashboard: verbrauch-ww-taglich 13:47:16.339DEBUGgrafanafound Dashboard: gerateleistung 13:47:16.370DEBUGgrafanafound Dashboard: gauges 13:47:16.378DEBUGgrafanafound Dashboard: umwalzpumpe 13:47:16.457DEBUGgrafanafound Dashboard: verbrauch-strom-taglich 13:47:16.468DEBUGgrafanafound Dashboard: signalstarke 13:47:16.488DEBUGgrafanafound Dashboard: leistung-solar 13:47:16.517DEBUGgrafanafound Dashboard: batterie-ladeleistung 13:47:16.523DEBUGgrafanafound Dashboard: temperaturen-ww-hz 13:47:16.578DEBUGgrafanafound Dashboard: batterie-soc 13:47:21.333DEBUGgrafanadone 13:47:22.671DEBUGcifsused copy path: /fritz.box/MemoryBoard/Share/Backup/ioBroker 13:47:22.717DEBUGcifsdone 13:47:23.278ERRORcleanBackup files not deleted from /opt/iobroker/backups because some errors. 13:47:23.280DEBUGcleandone 13:47:23.442DEBUGhistoryHTMLnew history html values created 13:47:23.534DEBUGhistoryHTMLdone 13:47:23.735DEBUGhistoryJSONnew history json values created 13:47:23.779DEBUGhistoryJSONdone 13:47:23.897DEBUGumountmount active, umount is started ... 13:47:29.090DEBUGumountumount successfully completed 13:47:29.094DEBUGumountdone 13:47:30.305DEBUGwhatsappdone 13:47:31.463DEBUGnotificationAdmin notification will be sent 13:47:31.505DEBUGnotificationdone 13:47:31.621INFOguiDas Backup wurde erfolgreich erstellt! -
@wibear sagte in Backitup Fehlermeldung bei Grafana Backup:
vers=1.0
Ich würde auch die SMB-Version mal in die Gegenwart holen. Das sollte auch mit 3.1.1 laufen und die Meldung
mount attempt with smb option failed.
wäre weg.
-
Hallo Thomas, wie kann ich die SMB Version auf 3.1.1 bringen?
Werden dann nicht nur die Fehlermeldungen verschwinden, sondern auch das Grafana Backup sauber laufen?
Danke und Gruß -
@wibear sagte in Backitup Fehlermeldung bei Grafana Backup:
Hallo Thomas, wie kann ich die SMB Version auf 3.1.1 bringen?
In den Einstellungen des Backitup-Adapters.
Werden dann nicht nur die Fehlermeldungen verschwinden, sondern auch das Grafana Backup sauber laufen?
Vermutlich nicht. Aber es ist ein kleiner Baustein zu einem vollfunktionierenden Backup.
-
@wibear Die Fehlermeldungen in Grafana liegen an Grafana 12.0.0 und werden mit dem nächsten Update von Backitup behoben
-
@simatec Danke für die Info, aber die Github Version kann ich doch einfach weiter laufen lassen? Oder spricht hier was dagegen ?
Grüße
-
@michaelf sagte in Backitup Fehlermeldung bei Grafana Backup:
aber die Github Version kann ich doch einfach weiter laufen lassen? Oder spricht hier was dagegen ?
Man verwendet solche Versionen aber nicht produktiv, wenn es ein stabiles Release mit den gleichen Funktionen gibt.
Wenn die Versionsnummer die aus dem github übersteigt wird ohnehin wieder eine Repository-gestützte Version installiert werden. -
@thomas-braun Auf die Stable update ich natürlich wieder, wollte nur jetzt nicht wieder auf die Version mit der Fehlermeldung zurück.
Grüße
-
@simatec
Danke für die Info!
